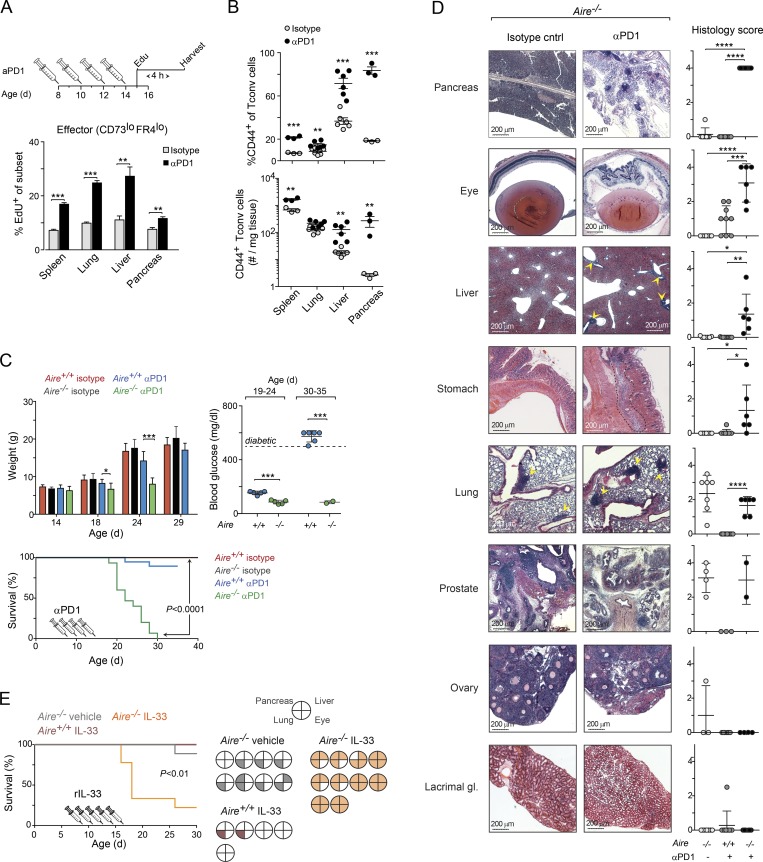
Figure 9.
PD-1 inhibition or treatment with IL-33–induced early-onset autoimmunity in Aire-deficient NOD perinates. (A) Impact of αPD-1 treatment on T cell proliferation. Top: αPD-1 treatment regimen for data shown in A–D. Bottom: Summary of percentage of proliferating effector T cells in various organs 4 h after EdU injection (n = 3–6 mice/group; see Fig. S5 E for flow cytometric plots and corresponding data for anergic T conv cells). (B) Frequencies and numbers of CD44+ T conv cells from Aire−/− mice (n = 3–6 mice/group). (C) Impact of αPD-1 treatment on autoimmune disease. Upper left: Weight change. Right: Blood-glucose levels, measured at two time points after mAb injection (n = 5–6 mice/group). Bottom: Survival curves (n = 11–15 mice/group); mice were sacrificed if their weight fell to <20% of that of control-treated littermates or if they developed diabetes. P value determined by log-rank (Mantel–Cox) test. (D) Histopathology analysis of organs from mice shown in C (n = 6–9 mice/group). Additional organs are shown in Fig. S5 G. Scale bars, 200 µm. (E) Impact of IL-33 treatment on autoimmune disease in NOD.Aire−/− mice. Left: Survival curves (n = 5–10 mice/group). Right: Histopathology analysis at the time of death or end of the experiment (30 d after birth). Filled sections represent infiltrated tissues (see Fig. S8 C for histology scores). Data are pooled from at least two independent experiments and show mean ± SD. Statistical analyses as in Fig. 1. *, P ≤ 0.05; **, P ≤ 0.01; ***, P ≤ 0.001; ****, P ≤ 0.0001.

