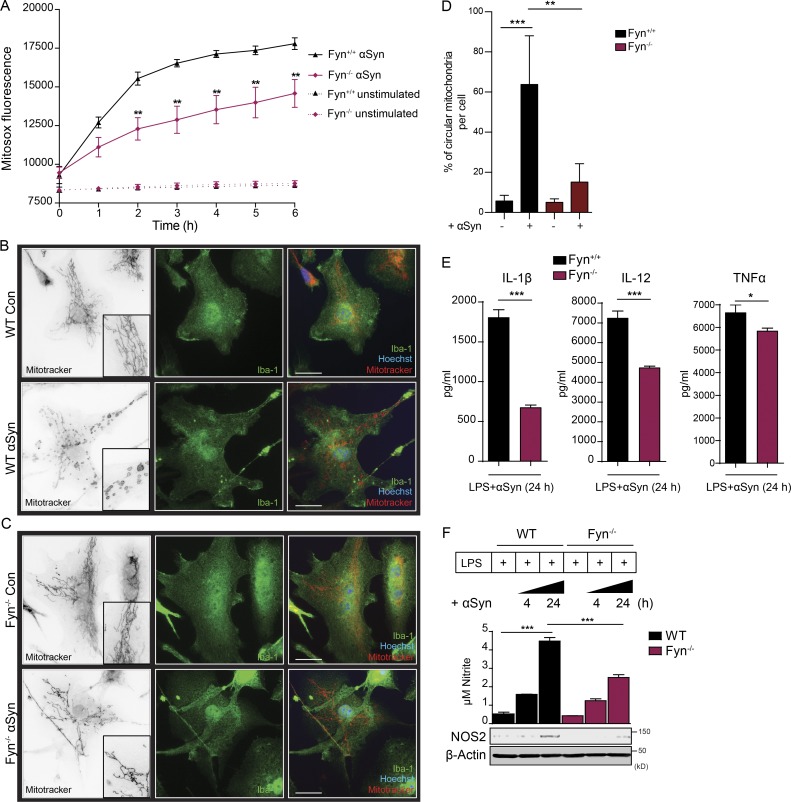
Figure 3.
Fyn-dependent αSyn uptake into microglial cells induces mitochondrial ROS generation. (A) MitoSOX assay shows diminished mitoROS generation from αSyn-treated Fyn−/− microglia. Error bars represent mean ± SEM. One-way ANOVA followed by Tukey’s post hoc test (n = 3). (B and C) ICC analysis reveals diminished mitochondrial morphology deficits observed in the aggregated αSyn-treated Fyn−/− microglia. Scale bars, 15 µm. Con, control. (D) Quantification of mitochondrial circularity. Error bars represent mean ± SEM. One-way ANOVA followed by Tukey’s post hoc test (n = 3). (E) LPS-primed αSyn-treated WT microglia produced higher amounts of proinflammatory cytokines than Fyn-deficient microglia, as evidenced by Luminex supernatant analysis. Error bars represent mean ± SEM. Unpaired two-tailed t test (n = 4). (F) αSyn treatment induced the production of supernatant nitrite and NOS2, as evidenced by Griess assay and immunoblots, respectively, but did so to a significantly lesser extent in Fyn-deficient microglia. Error bars represent mean ± SEM. One-way ANOVA followed by Tukey’s post hoc test (n = 3). Asterisks indicate the level of statistical significance: *, P ≤ 0.05; **, P ≤ 0.01; ***, P ≤ 0.001.

