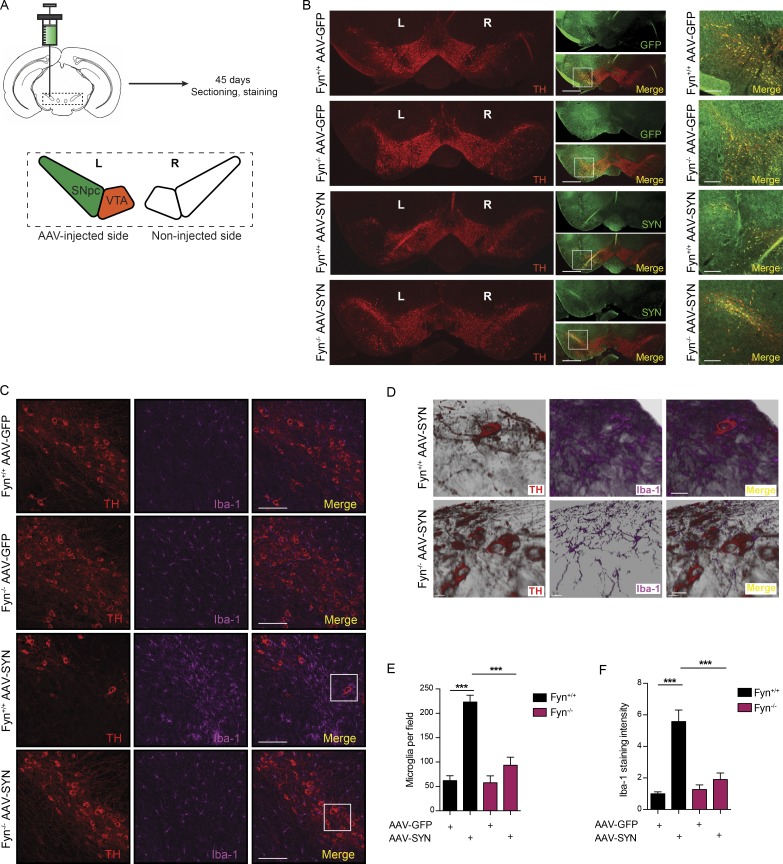
Figure 6.
Diminished microgliosis activation in Fyn-deficient mice using the AAV-SYN PD model. (A) Representational diagram of AAV injection site in mice (left [L] and right [R]). VTA, ventral tegmental area. (B) Stereotaxic injection of AAV-GFP– and AAV-SYN–overexpressing particles into the SNpc resulted in specific targeting of SNpc dopaminergic neurons, as indicated by a colocalization of TH and GFP/human αSyn expression. Scale bars, 500 µm (left panel) and 100 µm (right panel). (C) IHC analysis shows massive microgliosis within the SNpc of Fyn+/+ mice injected with the AAV-SYN particles, but not in Fyn−/− mice. Scale bars, 100 µm. (D) 3D reconstruction of the Z-stack images in the ventral midbrain of AAV-SYN–injected WT and Fyn−/− reveals contrasting microglial response between the genotypes. Scale bars, 20 µm. (E) Quantification of the number of microglia per field in the SNpc in AAV-GFP– or AAV-SYN–injected Fyn+/+ and Fyn−/− ventral midbrain sections. Error bars represent mean ± SEM. One-way ANOVA followed by Tukey’s post hoc test (n = 5 mice per group). (F) Quantification of the number of microglia Iba-1 staining intensity in the SNpc in AAV-GFP– or AAV-SYN–injected Fyn+/+ and Fyn−/− ventral midbrain sections. Error bars represent mean ± SEM. One-way ANOVA followed by Tukey’s post hoc test (n = 5 mice per group). Asterisks indicate the level of statistical significance: ***, P ≤ 0.001.

