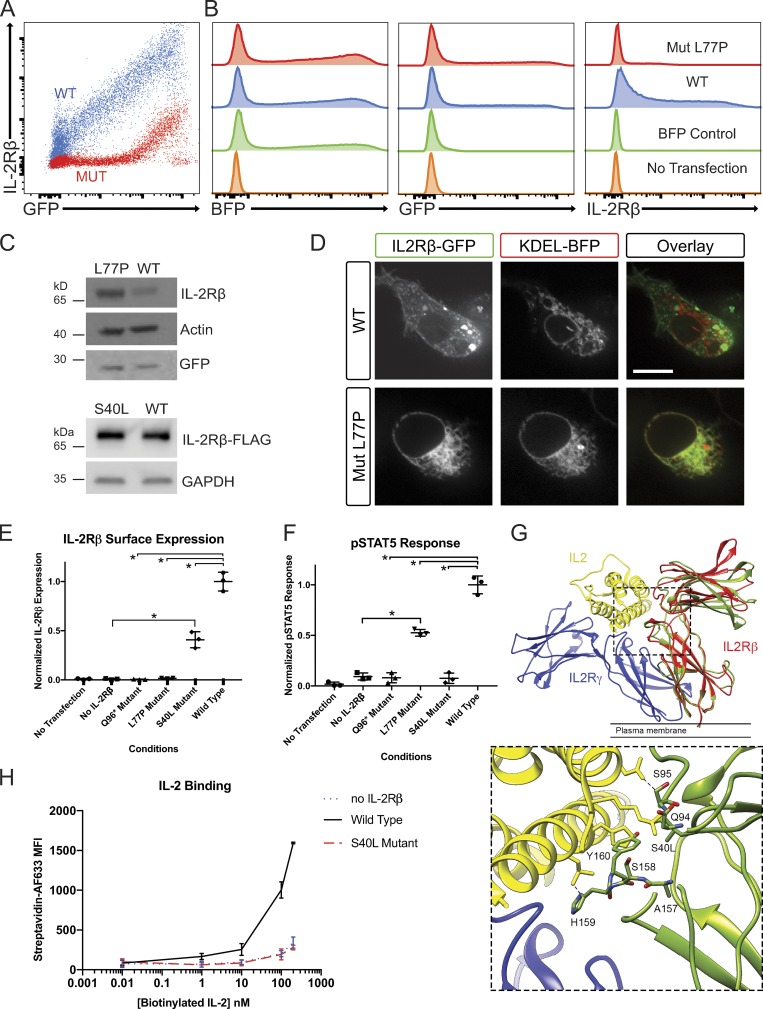
Figure 3.
Investigation of IL-2Rβ deficiency mechanisms in a HEK293T transfection model. (A) FACS plot of GFP and IL-2Rβ expression by HEK293T cells transfected with pHTC-wtIL2RB (red) and pHR-TetON-BFP or transfected with pHTC-mutIL2RB (blue) and pHR-TetON-BFP. (B) Histograms of BFP, GFP, or IL-2Rβ expression given the listed four transfection conditions: WT, mutant (Mut), TetON only, and no transfection. (C) Western blot of HEK293T cells transfected with pHTC-wtIL2RB-GFP or pHTC-mutIL2RB-GFP. Loading controls: actin and GFP. (D) Confocal images of live HEK293T cells cotransfected with KDEL-BFP (ER localization marker) and WT-IL2RB-GFP or Mut-IL2RB-GFP. Bar, 10 µm. (E) Graph of normalized surface IL-2Rβ expression in HEK293T cells with exogenous IL-2R system for the three disease-causing IL2RB mutations. *, P < 0.05, Mann-Whitney U test. (F) Graph of pSTAT5 response to high-dose IL-2 in HEK293T cells with exogenous IL-2R system. *, P < 0.05, Mann-Whitney U test. (G) MD simulation of the receptor cytokine binding interface in WT IL-2Rβ and the S40L variant. The IL-2R subunit is colored in blue, IL-2Rβ in red, and IL-2 in yellow (PDB: 5M5E). The structure of S40L mutant after 100 ns of MD simulation (green) is shown superimposed on the structure of the WT IL-2Rβ after 100 ns MD simulation (red). The leucine side chain clashes with main chain atoms in the BC2 loop (residues 157–165) of the D2 domain, which contributes directly to IL-2 binding. A zoomed in panel of the IL-2 and MD simulated S40L mutant IL-2Rβ interface is provided. (H) Graph of IL-2 binding by WT IL-2Rβ, S40L mutant, and no IL-2Rβ negative control in HEK293T cells measured by flow cytometry using a biotin–streptavidin system. MFI, mean fluorescence intensity. Experiments A–F and H were repeated in triplicate with graphs showing mean ± SEM.

