Figure 6.
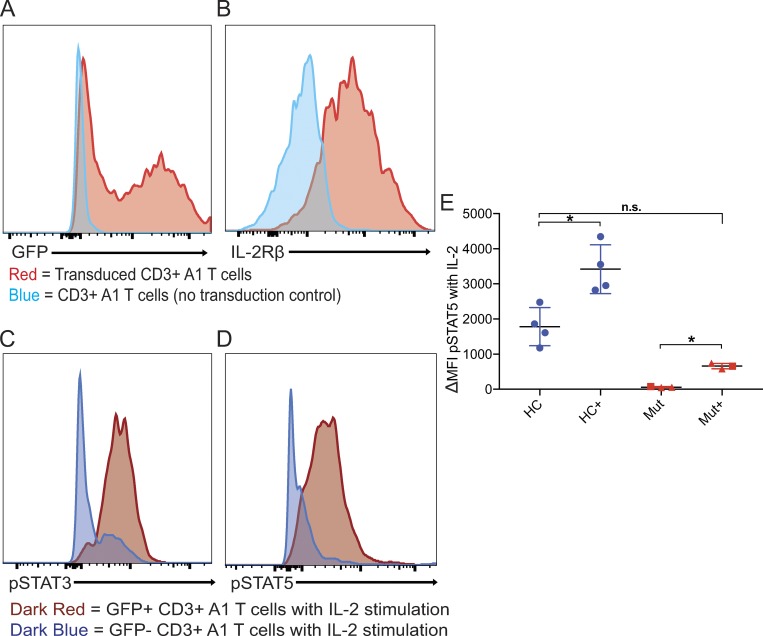
Lentiviral rescue of IL-2Rβ and STAT phosphorylation in primary T cells. (A) Histogram showing GFP expression in patient A1 CD3+ T cells transduced (red) with lentiviral WT IL-2Rβ and GFP and no transduction control (blue). (B) Histogram showing IL-2Rβ expression in patient A1 CD3+ T cells transduced (red) with lentiviral WT IL2RB and GFP and no transduction control (blue). (C) Histograms showing STAT3 phosphorylation in response to IL-2 stimulation in transduced (dark red) and nontransduced (dark blue) CD3+ A1 T cells. (D) Histograms showing STAT5 phosphorylation in response to IL-2 stimulation in transduced (dark red) and nontransduced (dark blue) CD3+ A1 T cells. (E) Graph of delta mean fluorescence intensity (MFI) of pSTAT5 between IL-2 stimulated and unstimulated in healthy controls (HC) and L77P patients A1 and B1 transduced and no transduction control. *, P < 0.05, Mann-Whitney U test; n.s., not significant. Experiments A–E were performed in triplicate with the graph showing mean ± SEM.

