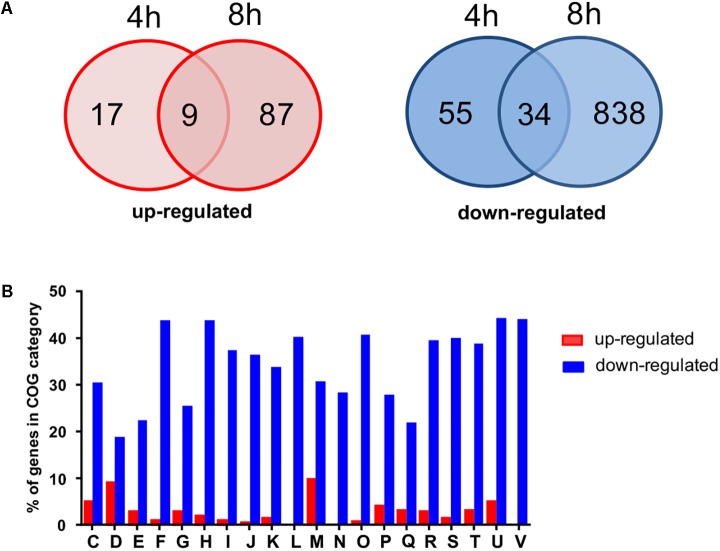
FIGURE 2.
Transcriptome analysis (RNA-seq) of genes differently expressed in RomR clone compared to HG001 wild type strain. (A) The Venn diagrams show numbers of genes that are at least fourfold up- or downregulated after 4 and 8 h of growth in BM in the RomR clone. (B) Percentage of genes being at least fourfold up (red bars) or downregulated (blue bars) in each of cluster orthologous groups (COG) based on functional categories. Designations of functional categories: C, energy production and conversion; D, cell division and chromosome partitioning; E, amino acid metabolism and transport; F, nucleotide metabolism and transport; G, carbohydrate metabolism and transport; H, coenzyme metabolism; I, lipid metabolism; J, translation, ribosomal structure and biogenesis; K, transcription; L, DNA replication, recombination, and repair; M, cell wall structure and biogenesis, outer membrane; N, Cell motility and chemotaxis; O, post-translational modification, protein turnover, chaperone functions; P, Inorganic ion transport and metabolism; Q, secondary metabolites biosynthesis, transport and catabolism; R, general functional prediction; T, signal transduction mechanisms; U, secretion; V, defense mechanisms.

