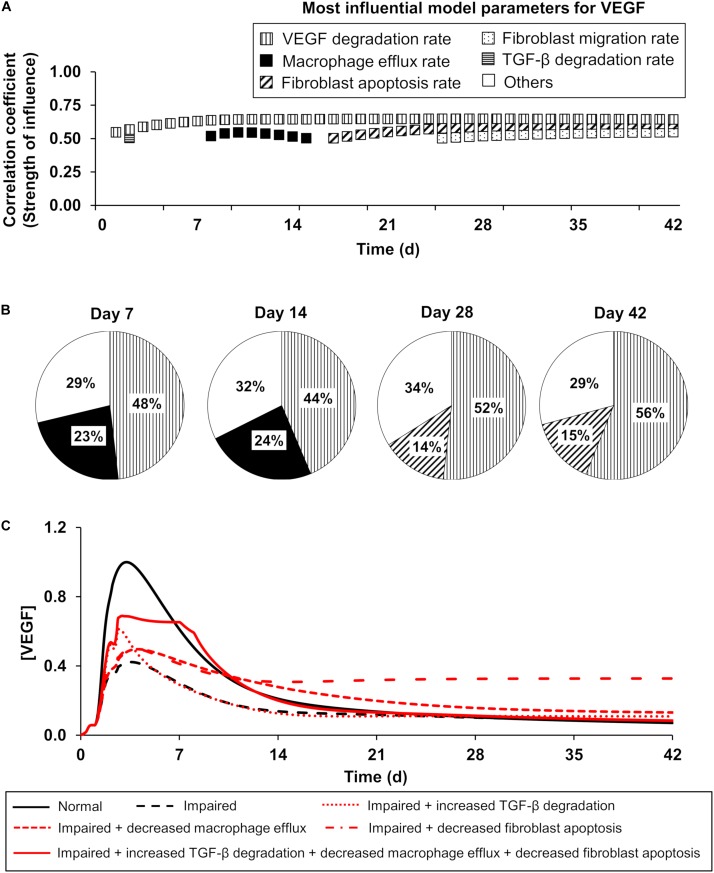
FIGURE 4.
The model-predicted most influential model parameters for VEGF: temporal dependencies of the influence strength. Patterns represent a given model parameter. Horizontal stripes: TGF-β degradation rate, vertical stripes: VEGF degradation rate, solid black: macrophage efflux rate, diagonal stripes: fibroblast apoptosis rate, and dotted: fibroblast migration rate. (A) Patterned squares show the PRCCs (reflecting the strength of influence) between the most influential model parameters and the VEGF concentration on different days in the model-predicted time course. The model parameters whose PRCCs were above 0.5 with P ≤ 0.05 were identified as the most influential model parameters for a given model variable. (B) Pie chart shows the percentage of the 51,175 simulated wound-healing scenarios for which VEGF exhibited the highest sensitivity to a given parameter among the 159 model parameters. Open square (labeled as others) represents the parameters (among the 159 model parameters) to which VEGF exhibited the highest sensitivity in a fraction of simulations that was too small (<10%) to be considered as influential. (C) Model-predicted time courses of VEGF concentration during normal angiogenesis (solid black lines), impaired angiogenesis (dashed black lines), and four simulated intervention scenarios (red lines), wherein the parameters representing three of the model-identified influential processes were modified. The four interventions were simulated as follows: (1) increasing the TGF-β degradation rate by 3-fold from day 1 to day 42 post-wounding (dotted red line), (2) decreasing the macrophage efflux rate by 3-fold from day 1 to day 42 post-wounding (dashed red line), (3) decreasing the fibroblast apoptosis rate by 3-fold from day 1 to day 42 post-wounding (dash-dot red line), and (4) simultaneously increasing TGF-β degradation by 3-fold from day 1 to day 3 post-wounding, decreasing the macrophage efflux rate by 15-fold from day 2 to day 7 post-wounding, and decreasing the fibroblast apoptosis rate by 15-fold from day 1 to day 8 post-wounding (solid red line). Each model-predicted time course was normalized by dividing it by the maximal value of the normal time course of the VEGF concentration.

