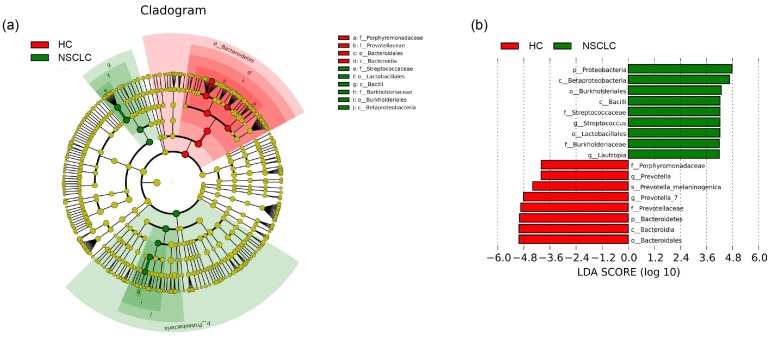
Figure 3.
Different structures of salivary microbiota between non-small cell lung cancer and healthy control groups. (a) Cladograms of bacterial lineages with significantly different representation in non-small cell lung cancer and the healthy control groups. Taxonomic cladogram obtained from LEfSe analysis of 16S sequences (The diameter of each circle is proportional to taxon abundance). (b) Histogram of the linear discriminant analysis (LDA) scores for differentially abundant bacterial taxa between non-small cell lung cancer patients and healthy controls. Only taxa meeting an LDA significant threshold > 4.0 are shown. Red (HC) indicates the healthy controls, and green (NSCLC), non-small cell lung cancer group

