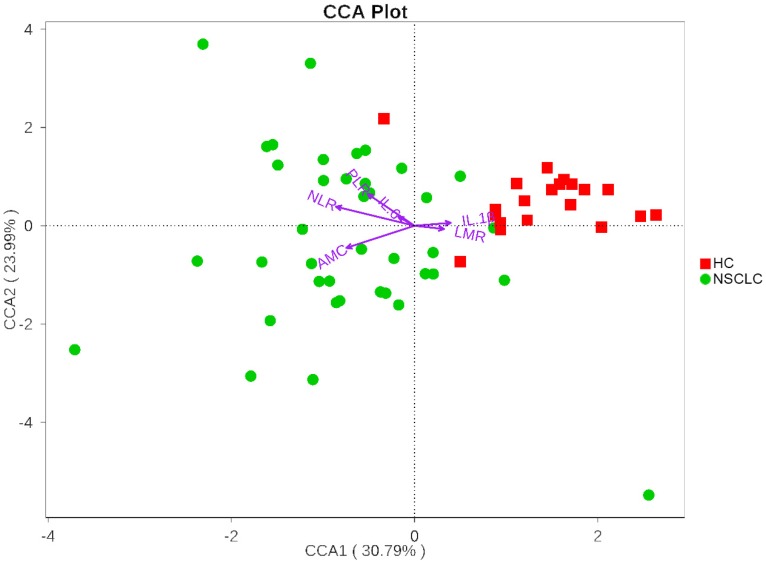
Figure 4.
Canonical Correspondence Analysis (CCA) illustrating relations between bacteria taxa and systemic inflammatory markers in our study groups. Arrows indicate the direction and magnitude of the systemic inflammatory markers associated with bacterial community structures. The explained variance of the principal axes [Axis 1 (horizontally) and Axis 2 (vertically)] are 30.79% and 23.99%, respectively. NSCLC represent non-small cell lung cancer group, and HC, healthy controls.

