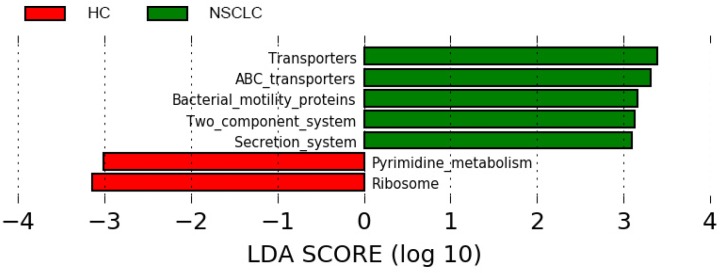
Figure 6.
Different structures of predicted KEGG pathways between non-small cell lung cancer and healthy control groups. Histogram of the linear discriminant analysis (LDA) scores for differentially abundant bacterial taxa between non-small cell lung cancer patients and healthy controls. Only taxa meeting an LDA significant threshold >3.0 are shown. NSCLC represent non-small cell lung cancer group, and HC, healthy controls.

