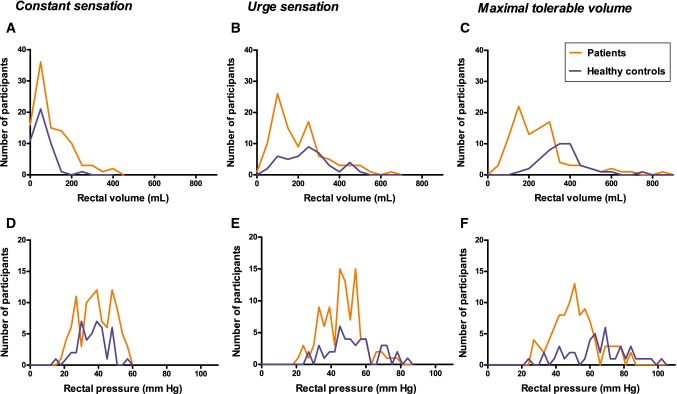
Fig. 2.
Distribution of rectal volumes and pressures at different rectal sensation levels and MTV. There is no normal distribution of the rectal volumes of patients (indicated in red) and healthy controls (indicated in blue) at CS (a), US (b) and MTV (c). However, the rectal pressure distributions at CS (d), US (e) and MTV (f) resembles the Bell curve, indicating normal distributions in both patients and healthy controls

