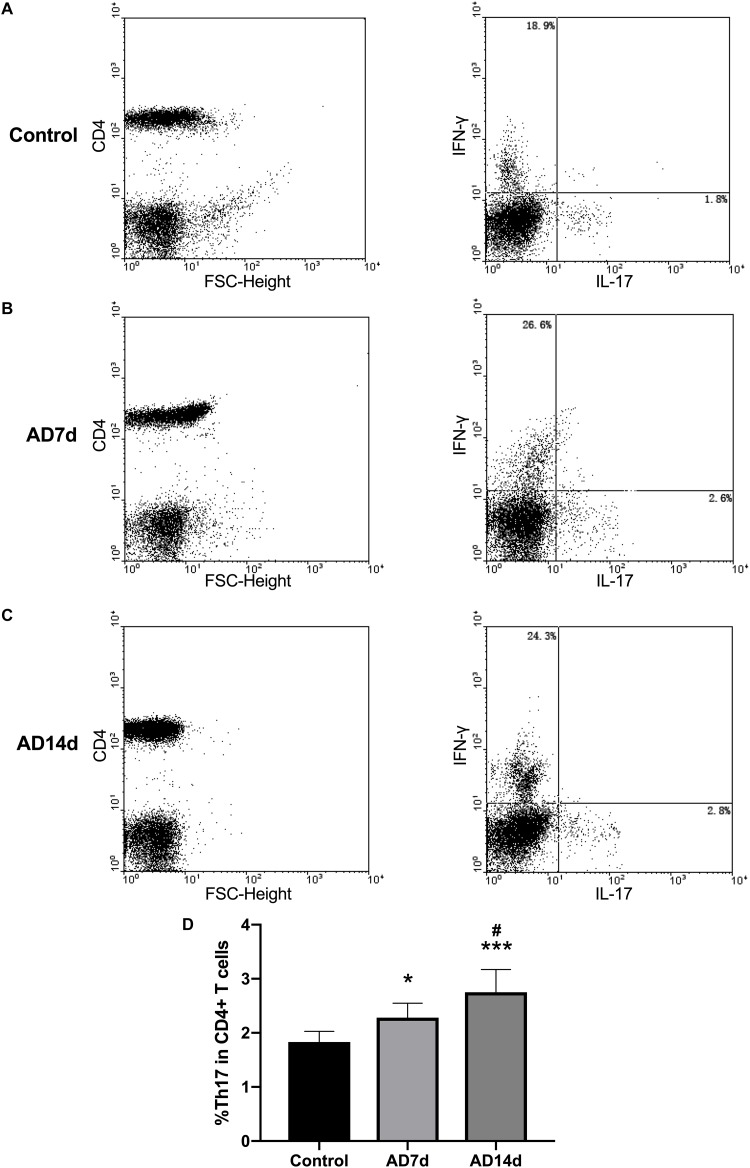
FIGURE 6.
Elevated circulating Th17 populations in AD rats. The population of Th17, a subset percent of total CD4+ T cells, was estimated with use of flow cytometry. Dot plots shown are representative of rats in the Control (A), AD7d (B), and AD14d (C) groups. Th17 cells were confirmed as CD4+IL-17+IFN-γ- cells. Numbers in each compartment indicate the proportions of Th17 and Th1 in CD4+ cells. (D) Percent of Th17 in total CD4+ T cells in the Control, AD7d and AD14d groups. n = 9 per group, mean ± standard deviation, ∗P < 0.05, ∗∗∗P < 0.001 vs. Control group, #P < 0.05 vs. AD7d group.

