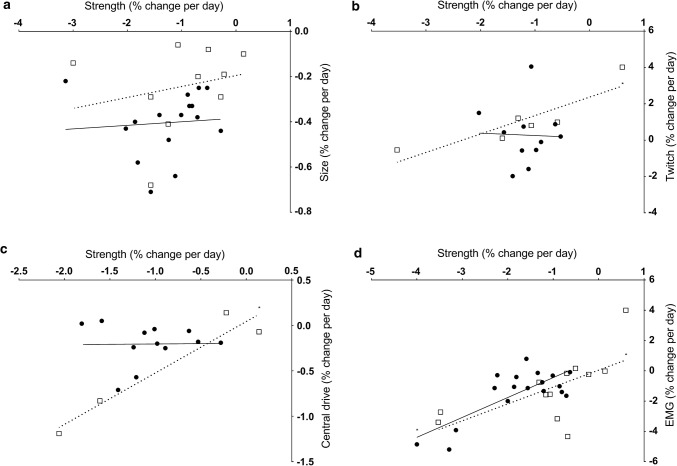
Fig. 9.
Correlation between muscle strength and size change per day (a), muscle strength and resting twitch force (b), muscle strength and central drive (c), muscle strength and EMG (d). Lower limb values are shown as circles with a solid line, upper limb values as squares with a dotted line. Significant correlations are indicated with an asterisk (*). EMG electromyography

