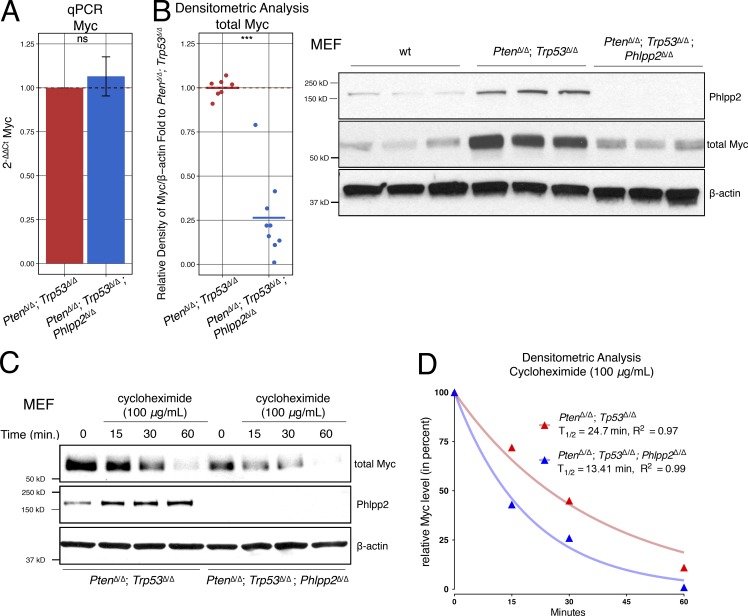
Figure 3.
Phlpp2 status controls Myc stability. (A) Myc transcript levels measured by quantitative PCR is not affected by genotype. Error bars, SD; n = 4; P > 0.05 with Student’s t test. (B) Myc protein is decreased in triple-mutant cells by almost 75%. Error bars, SD; n ≥ 7; ***, P < 0.001 with Student’s t test (left panel). Right panel: Myc and Phlpp2 protein levels from WT, Pten/Trp53-, and Pten/Trp53/Phlpp2-negative cells. (C) Myc half-life as measured in MEFs of both genotypes after treatment with 100 µg/ml of cycloheximide. (D) Quantification of Western blot shows significantly shortened half-life of Myc in triple-mutant cells compared with the Phlpp2-positive cells. This graph represents densitometric analysis of Myc normalized with β-actin from the corresponding Western blot in Fig. 3 C. Lines (blue: PtenΔ/Δ;Trp53Δ/Δ;Phlpp2Δ/Δ; and red: PtenΔ/Δ;Trp53Δ/Δ) represent the nonlinear regression model, using the one-phase exponential decay curves. Myc half-life T1/2 was calculated based on this model, n = 1. Note that independent biological replicates are shown and quantified in Fig. S2, B and C. ns, not significant; qPCR, quantitative PCR; wt, wild-type.

