Figure 1.
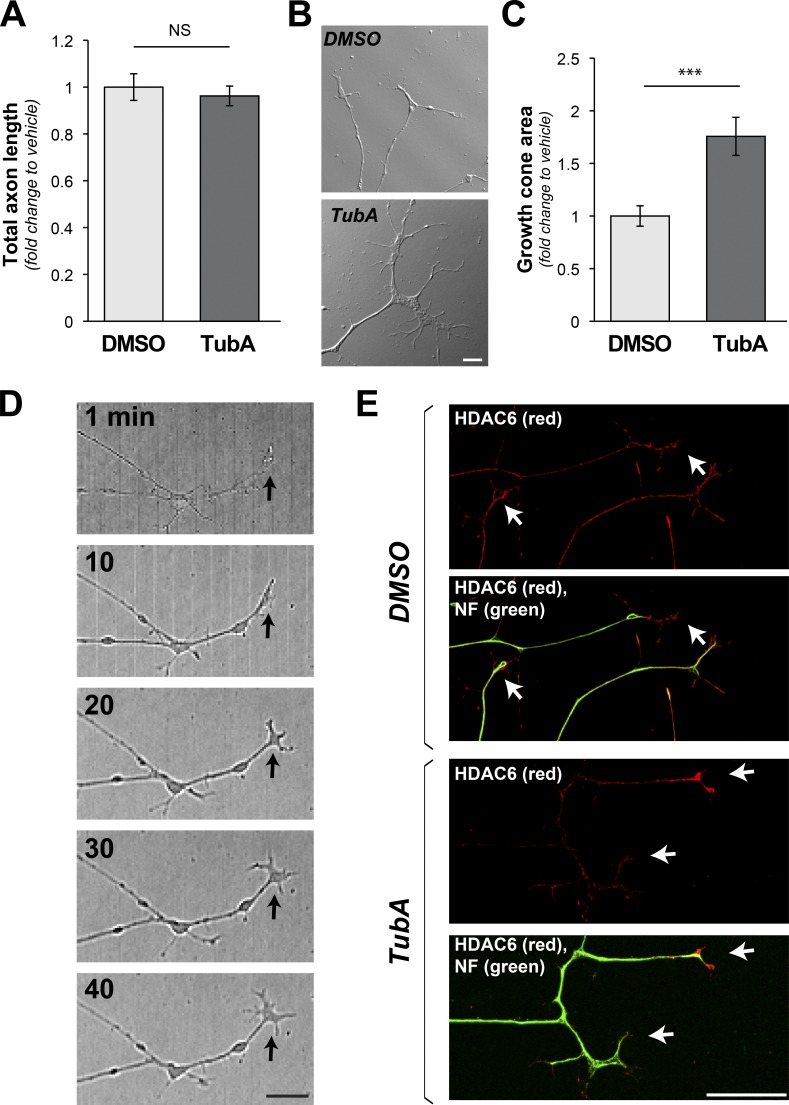
Growth cones expand on inhibition of HDAC6. (A) Quantification of neurite length for dissociated DRGs cultured on laminin with addition of HDAC6 inhibitor TubA (10 µm) versus vehicle control (DMSO) over 1 h is shown as average fold-change relative to vehicle ± SEM (n ≥ 95 neurons across three independent experiments; NS by one-way ANOVA with Bonferroni post hoc). (B and C) Representative DIC images of distal axons from DRG neurons cultured as in A are shown (B). 1-h TubA treatment appears to increase growth cone size. Analyses of growth cone area across multiple experiments show a significant increase in area after TubA treatment (C). Values are average fold-change ± SEM (n ≥ 26 neurons over at least three culture preparations; ***, P ≤ 0.005 by one-way ANOVA with Bonferroni post hoc; scale bar = 5 µm; 40×/1.3 NA objective used). (D) Representative time-lapse image sequence in DIC for a single axon from larger tiled images after addition of TubA as in A. Arrows indicate growth cone position (scale bar = 10 µm). (E) Representative epifluorescent images for HDAC6 (red, Cy5) and NF (green, Cy3) immunoreactivity. Prominent HDAC6 signals are seen in distal axons and growth cones (arrows) regardless of TubA exposure. Axonal localization of transfected HDAC6 protein is shown in Fig. S1 A (scale bar = 10 µm; 40×/1.3 NA objective used).

