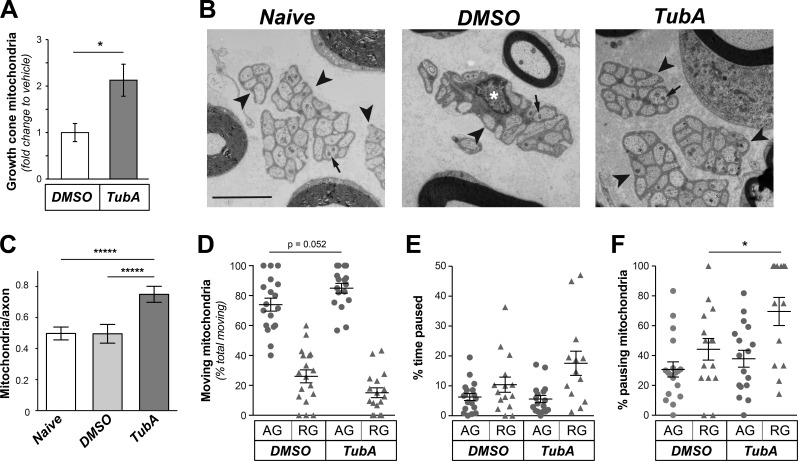
Figure 2.
Inhibition of HDAC6 alters axonal mitochondrial transport both in vitro and in vivo. (A) Number of mitochondria in growth cones after exposing DRG cultures to 10 µM TubA versus vehicle (control) for 1 h is shown as average fold-change in number of mitochondria per growth cone ± SEM (n = 13 axons across three culture preparations; *, P ≤ 0.05 by one-way ANOVA with Bonferroni post hoc analysis). See Fig. S3 (A–E) for kinetics of mitochondria movement in axons. (B) Representative EMs of Remak bundles (arrowheads) in naive Sciatic nerve and nerves after 2 h vehicle (DMSO) or TubA injection are shown. Arrows indicate mitochondria in the unmyelinated axons. Note that a Schwann cell nucleus (asterisk) is seen in the Remak bundle for DMSO image but not the other two micrographs (scale bar = 3 µm). (C) Quantification of number of mitochondria per unmyelinated axon from EM images as in B is shown as average ± SEM (n ≥ 5; *****, P ≤ 0.0001 by one-way ANOVA with Bonferroni post hoc analysis). (D–F) Quantification for indicated parameters for mitochondrial transport in sciatic nerve in vivo using tetramethylrhodamine, ethyl ester, perchlorate to visualize mitochondria is shown. The percentage pausing mitochondria is significantly different for retrogradely tracked mitochondria in DMSO versus TubA injected nerves (n ≥ 13 axons tracked over four animals; *, P ≤ 0.05 and as indicated by ANOVA with Holm-Sidak’s multiple comparisons test).

