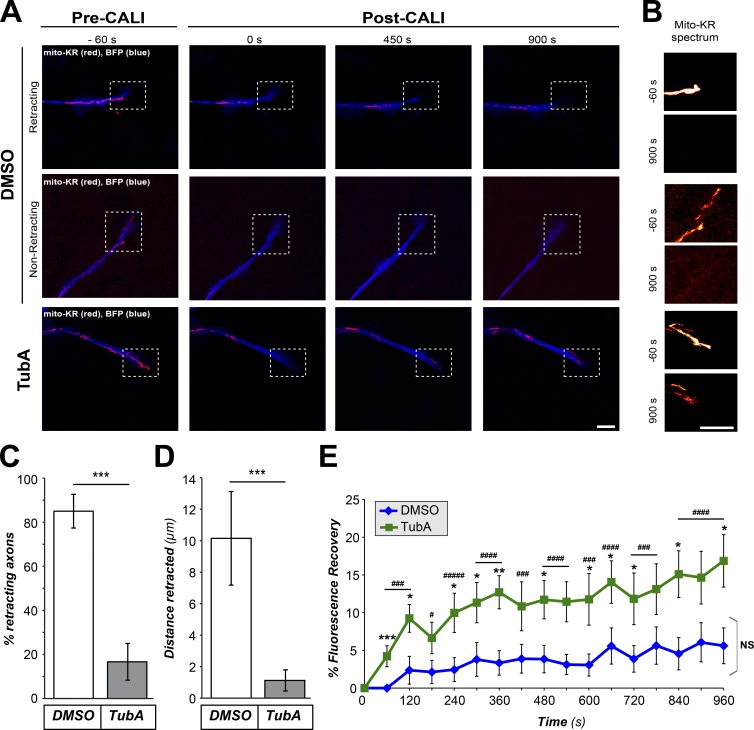
Figure 3.
HDAC6-inhibited growth cones are protected from collapse after mitochondrial ablation. (A and B) Representative images from CALI time-lapse sequence are shown for DRGs cultured on laminin and treated with vehicle control (DMSO) versus 10 µM TubA for 1 h (A). BFP is shown in blue as an axonal marker and Mito-KR signal is shown in red. Boxed regions represent ROI for distal axon and growth cone that was subjected to photoactivation of Mito-KR to ablate mitochondria. (B) Magnified view of ROI with Mito-KR signal as indicated spectral intensity for −60-s and +900-s panels from time lapse. Fig. S4 (A and B) shows that axons analyzed across the DMSO- and TubA-treated cultures had no significant differences in growth cone area or Mito-KR signal intensity before CALI sequence. Images were equivalently adjusted for brightness and contrast before cropping using ImageJ (scale bars = 10 µm for main panels, 2 µm for insets; 63×/1.4 NA objective used). (C and D) Quantifications of percentage of axons retracting (C) and retraction distance (D) from image sequences as in A are shown as average ± SEM (n ≥ 13 across three culture preparations; ***, P ≤ 0.005 by one-way ANOVA with Bonferroni post hoc analysis). (E) Recovery of Mito-KR red fluorescence in photoactivated ROI from image sequences as in A is shown as average of normalized percentage recovery ± SEM (n ≥ 13 axons from three independent experiments; *, P ≤ 0.05; **, P ≤ 0.01; ***, P ≤ 0.005 vs. t = 0; ###, P ≤ 0.005; ####, P ≤ 0.001; #####, P ≤ 0.0005 for TubA vs. control; and NS vs. t = 0 s by one-way ANOVA with Bonferroni post hoc analysis).

