Figure 6.
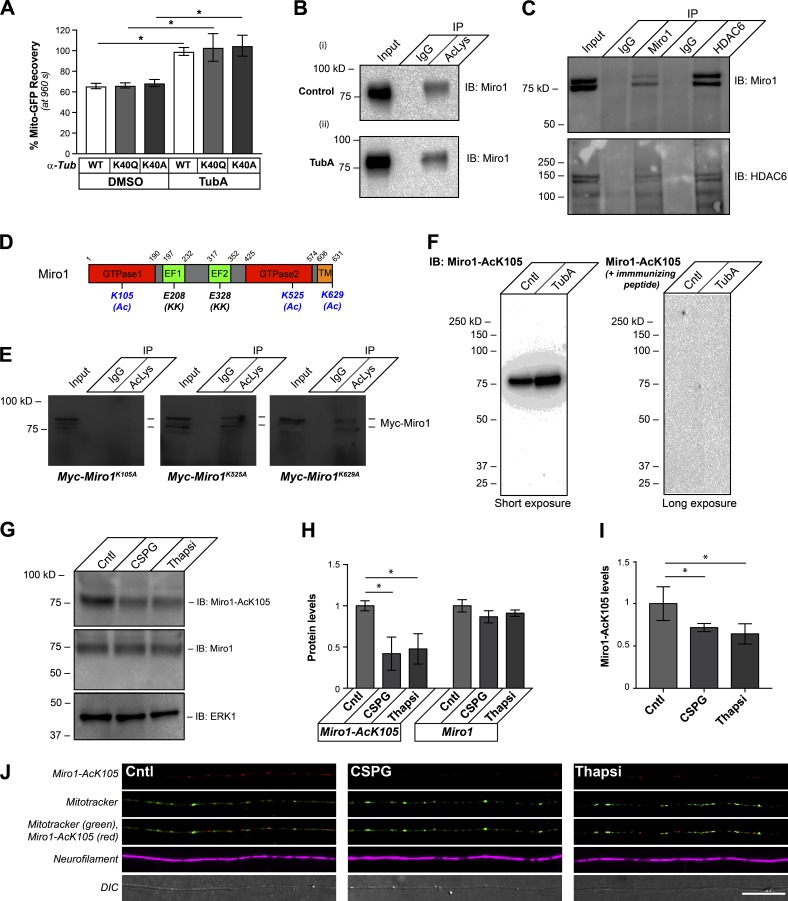
Miro1 K105Q is an axonal substrate for HDAC6 after exposure to CNS growth inhibitors. (A) End-point FRAP for Mito-GFP recovery in distal axons of DRGs transfected with WT, acetyl-mimetic (K40Q), or nonacetylatable (K40A) α-tubulin constructs and plated onto laminin is shown as average of normalized percentage recovery ± SEM at 960 s after bleach. Exposure to 10 µM TubA significantly increases Mito-GFP recovery in all three conditions (*, P ≤ 0.05 for TubA-treated vs. its corresponding DMSO control by two-way ANOVA with Tukey post hoc). Fig. S6 (A and B) shows that these mutant α-tubulin proteins are incorporated into axonal microtubules and expressed at relatively equivalent levels. (B) Representative immunoblot is shown for Miro1 from input and immunoprecipitations with magnetic bead-conjugated nonimmune IgGs or anti–Ac-Lys antibody cocktail from DRG neurons treated with 10 µM TubA for 4 h. 10% of the protein lysate was used as input (pull-down efficiency of 10.1 ± 1.9% for control vs. 14.1 ± 2.2% for TubA over n = 4; P = 0.012 by two-tailed Student’s t test). (C) HDAC6 is detected in Miro1 immunoprecipitates, and Miro1 is detected in HDAC6 immunoprecipitates from cultured DRG neurons by immunoblotting. 10% of the protein lysate was used as input. (D) Schematic of rat Miro1 sequence with residues previously reported to be acetylated in nonneuronal cells indicated (K105, K525, and K629 plus (Ac)). The glutamate-to-lysine mutations that were previously reported to decrease Miro1 Ca2+ sensitivity are indicated by (KK). Residues corresponding to GTPase, EF-hand, and transmembrane (TM) domains are shown. (E) Representative immunoblots are shown for anti-Myc from DRG neurons transfected with Myc-Miro1K105A, Myc-Miro1K525A, or Myc-Miro1K629A plasmids and treated with 10 µM TubA for 4 h at 36 h after transfection (40 h in vitro). Input (10%) and immunoprecipitations with nonimmune IgG and Ac-Lys antibody cocktail. (F) Representative immunoblots are shown for anti–Miro1-AcK105 for DRG lysates ± 10 µM TubA. For the righthand blot, the anti–Miro1-AcK105 antibody was preincubated with 100 µg/ml immunizing peptide (short exposure = 30 s; long exposure = 3 min). (G and H) Representative immunoblots are shown in G for anti–Miro1-AcK105, anti-Miro1, and anti-Erk1 (loading control) from lysates of DRG cultures treated with 10 µg/ml aggrecan (CSPG) or 1 µM thapsigargin (Thapsi) for 4 h. H shows quantification of immunoblot signals across multiple experiments as average fold-change relative to control ± SEM (n = 3; *, P ≤ 0.05 by one-way ANOVA with pairwise comparison and Tukey post hoc tests). (I and J) Representative confocal projection images (XYZ) for anti-Miro1-AcK105 (Cy5), anti-NF (Cy3), and MitoTracker Green are shown as indicated in J for control, aggrecan-treated (CSPG) or thapsigargin-treated cultures. ImageJ was used for pseudocoloring and channel merging. Panel I shows quantification of the axonal anti-Miro1-AcK105 signals under these conditions as average fold-change relative to control ± SEM (n = 20; *, P ≤ 0.05 by one-way ANOVA with pairwise comparison and Tukey post hoc; scale bar = 20 µm; 100×/1.4 NA objective used).

