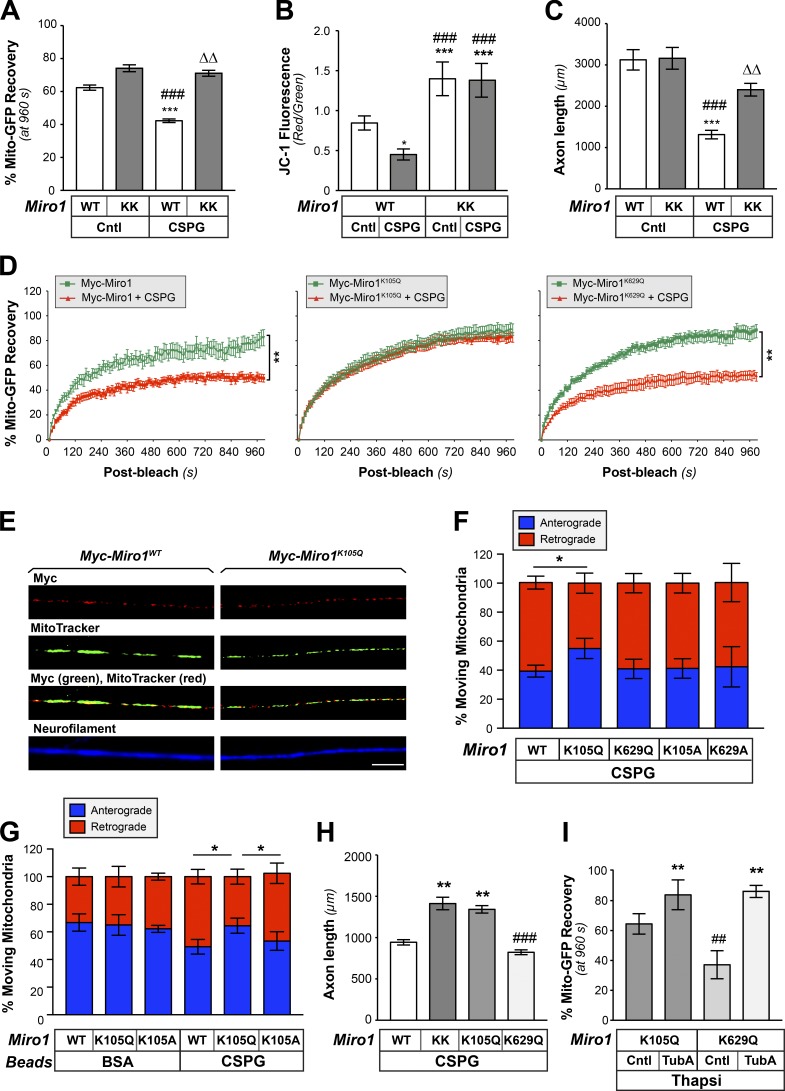
Figure 7.
Acetylation of Miro1 on K105 increases mitochondrial transport and supports axon growth on CNS growth inhibitory substrates. (A) End-point FRAP analysis for Mito-GFP in distal axons of DRGs transfected with either Myc-Miro1 (WT) or Myc-Miro1KK (KK) plasmids and cultured on laminin ± bath-applied 10 µg/ml aggrecan (CSPG) is shown as average of normalized percentage recovery ± SEM at 960 s after bleach (n ≥ 16 axons over four culture preparations; ***, P ≤ 0.005 vs. control + WT; ###, P ≤ 0.005 vs. control + Miro1KK; ΔΔ, P ≤ 0.01 vs. CSPG + WT by two-way ANOVA with Tukey post hoc). (B) Miro-KK expression prevents aggrecan-dependent decrease in axonal ψM as evidenced by JC-1 fluorescence ratio for DRGs cultured on laminin-coated (Cntl) versus aggrecan-coated (CSPG) coverslips. Average ratio ± SEM is shown (n = 20; *, P ≤ 0.05; ***, P ≤ 0.005 vs. control; ###, P ≤ 0.005 vs. CSPG by one-way ANOVA with pairwise comparison and Tukey post hoc). (C) DRGs transfected as in B were cultured on laminin (Cntl) or aggrecan (CSPG) substrates. Axon length assessed at 72 h after transfection is shown as average total axon length/neuron ± SEM (n ≥ 95 each over three DRG cultures; ***, P ≤ 0.005 vs. control + WT; ###, P ≤ 0.005 vs. control + Miro-KK; ΔΔ, P ≤ 0.01 vs. CSPG + WT as determined by two-way ANOVA with Tukey post hoc). (D) FRAP analyses for Mito-GFP in distal axons of DRGs transfected with Myc-Miro1, Myc-Miro1K105Q, or Myc-Miro1K629Q and cultured on laminin and then ± bath-applied 10 µg/ml aggrecan (CSPG) are shown as average normalized percentage recovery ± SEM (n ≥ 9 axons over three culture preparations; **, P ≤ 0.005 for indicated treatments by two-way ANOVA with Tukey honestly significant difference [HSD] post hoc). (E) Representative immunofluorescent images for Myc-Miro1 or Myc-Miro1K105Q (FITC) and NF (Cy5) along axons of cultured DRG neurons shows that both proteins localize to axons and colocalize with MitoTracker signals. See Fig. S7 A for Myc-Miro1K105A, Myc-Miro1K629Q, and Myc-Miro1K629A immunofluorescence (scale bar = 10 µm; 100×/1.4 NA objective used). (F) Percentage of moving axonal mitochondrial showing anterograde (blue) versus retrograde (red) directions in DRG neurons transfected with indicated Myc-tagged Miro1 constructs and plated on aggrecan (CSPG). Average values ± SEM are shown. See Fig. S7 B for axonal mitochondrial dynamics for these neurons cultured on laminin and Fig. S6 C for analyses of transport speed for laminin and CSPG cultured DRGs (n = 20 axons over three culture preparations; *, P ≤ 0.05 by one-way ANOVA with pairwise comparison and Tukey post hoc). (G) Percentage of retrogradely (red) and anterogradely (blue) moving mitochondria in growth cone of rat adult DRG neurons expressing Myc-Miro1K105Q or Myc-Miro1K105A and mito-GFP when axons are exposed to CSPG-coated versus control BSA-coated microspheres. Average values ± SEM are shown; note that Fig. S7 D shows that axonal mitochondrial transport is affected only by axonal exposure to the CSPG microspheres and when presented at the cell body (n = 15 axons over three culture preparations; *, P ≤ 0.05 by one-way ANOVA with pairwise comparison and Tukey post hoc). (H) Axon growth on substrate-bound aggrecan (CSPG) for DRGs transfected with Miro1 WT, KK, or acetyl-mimetic mutants (K105Q and K629Q) plasmids is shown as average total axon length/neuron ± SEM. Axon length was assessed at 72 h after transfection (n ≥ 75 each over three DRG cultures; **, P ≤ 0.005 vs. WT; ###, P ≤ 0.001 vs. Miro1KK and Miro1K105Q by two-way ANOVA with Tukey HSD post hoc). Myc-Miro-KK and Myc-Miro1K105Q are not statistically different. (I) End-point FRAP is shown for Mito-GFP recovery in distal axons of DRGs transfected with either Miro1 K105Q or K629Q plasmids and cultured on laminin followed by treatment with 1 µM thapsigargin plus vehicle control (DMSO), or 10 µM TubA is shown as average of normalized percentage recovery ± SEM at 960 s after bleach (n ≥ 16 axons over four culture preparations; **, P ≤ 0.01 vs. Miro1K105Q control or Miro1K629Q control; ##, P ≤ 0.01 vs. Miro1K105Q + TubA by two-way ANOVA with Tukey HSD post hoc).

