Figure 7.
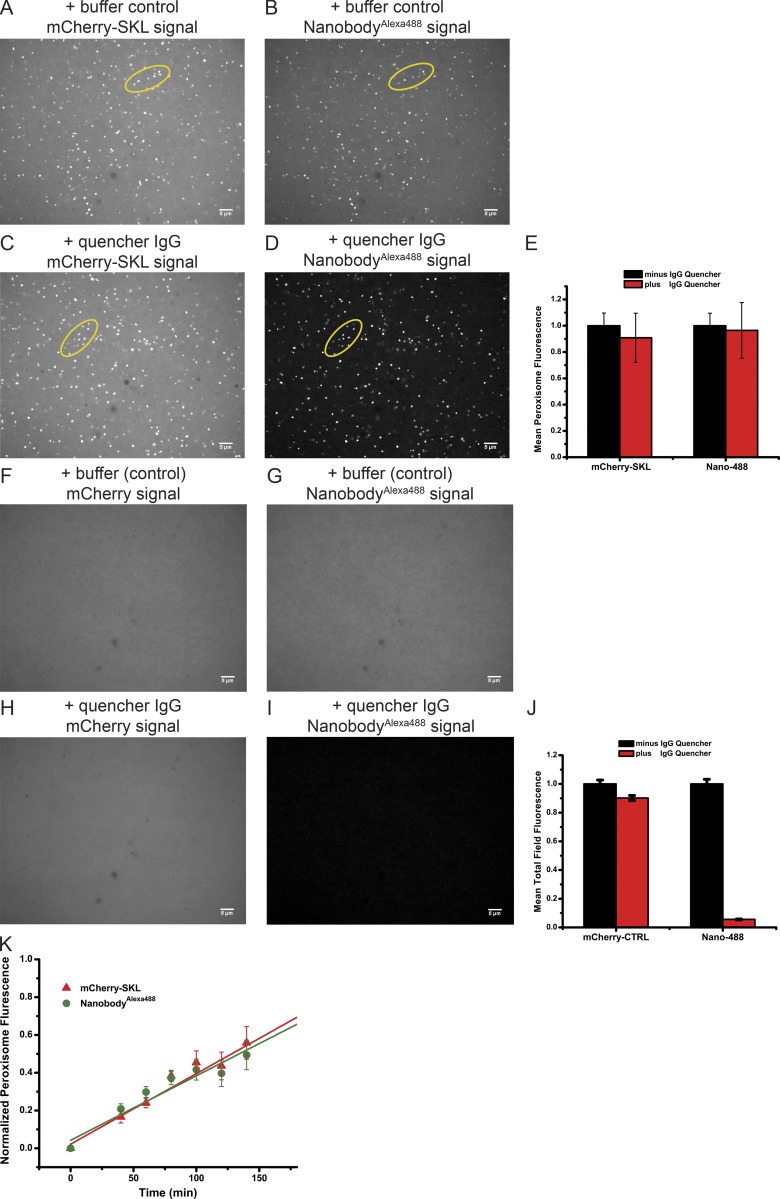
Transport of a folded protein into peroxisomes. (A) mCherry-SKL (40 µM) was preincubated with mCherry-nanobodies labeled with Alexa Fluor 488 (nanobodyAlexa488; 40 µM) for 20 min at 20–23°C. The complex was added at 0.9 µM final concentration to cleared Xenopus egg extract. The sample was incubated for 2 h at 18°C and imaged with a spinning-disk confocal microscope for mCherry fluorescence. (B) The same field shown in A was imaged for nanobodyAlexa488 fluorescence. The foci in A and B overlap (compare foci in ovals). (C) As in A, but Alexa Fluor 488-fluorescence–quenching antibodies (0.5 µM) were added after the import reaction. (D) The same field as in C was analyzed for Alexa Fluor 488 fluorescence. The foci in C and D overlap (compare foci in ovals). (E) Quantification of the experiments in A–D. Shown are the combined data of two parallel experiments in the absence or presence of the quenching antibodies (>20 images per condition). The fluorescence in each channel observed in the presence of quencher was normalized relative to the mean fluorescence in the absence of quencher. The mean and standard deviation of the mean are given. (F) As in A, but with mCherry lacking SKL. (G) The same field shown in F was imaged for nanobodyAlexa488 fluorescence. (H) As in F, but Alexa Fluor 488-fluorescence–quenching antibodies (0.5 µM) were added after the import reaction. (I) The same field as in H was analyzed for Alexa Fluor 488 fluorescence. (J) Quantification of the experiments in F–I. Shown are the combined data of two parallel experiments in the absence or presence of the quenching antibodies (>20 images per condition). The fluorescence in each channel observed in the presence of quencher was normalized relative to the mean fluorescence in the absence of quencher. The mean and standard deviation of the mean are given. (K) Kinetics of the accumulation of mCherry-SKL and nanobodyAlexa488 in peroxisomes. The fluorescence in both channels was quantitated at the indicated time points by automated image analysis. Shown are the mean and standard deviation of the combined data of two parallel experiments (>20 images per time point). Bars, 5 µm.

