Figure 1.
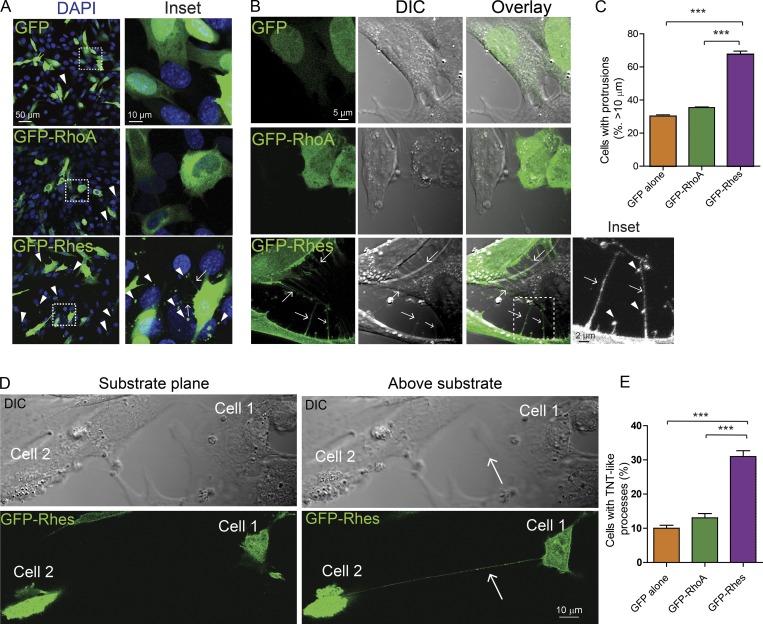
Rhes promotes filopodia-like cellular protrusions in striatal neuronal cells. (A) Striatal neuronal cells (STHdhQ7/Q7) expressing GFP alone or GFP-RhoA or GFP-Rhes. Inset: Arrowheads show GFP puncta in the untransfected cells, and arrows show the filopodia-like process. DAPI indicates nuclei. (B) Bright field images (DIC) of striatal neuronal cells expressing GFP alone or GFP-RhoA or GFP-Rhes. Arrows point to filopodia-like protrusions. Inset, arrowheads indicate vesicle-like structures. (C) Bar graph shows data mean ± SEM; one-way ANOVA (***, P < 0.001). GFP alone (30.16 ± 1.68, n = 317), GFP-RhoA (35.44 ± 0.67, n = 301), and GFP-Rhes (67.56 ± 3.43, n = 300). (D) Confocal and DIC image of striatal neuronal cell expressing GFP-Rhes shows two different planes (substrate plane or above substrate). Arrow points to TNT-like cellular protrusion visible above the substrate plane from cell 1 to cell 2. (E) Bar graph shows data mean ± SEM; one-way ANOVA (***, P < 0.001). GFP alone (10.00 ± 1.52, n = 317), GFP-RhoA (13.05 ± 2.15, n = 301), and GFP-Rhes (30.98 ± 2.92, n = 300).

