Figure 10.
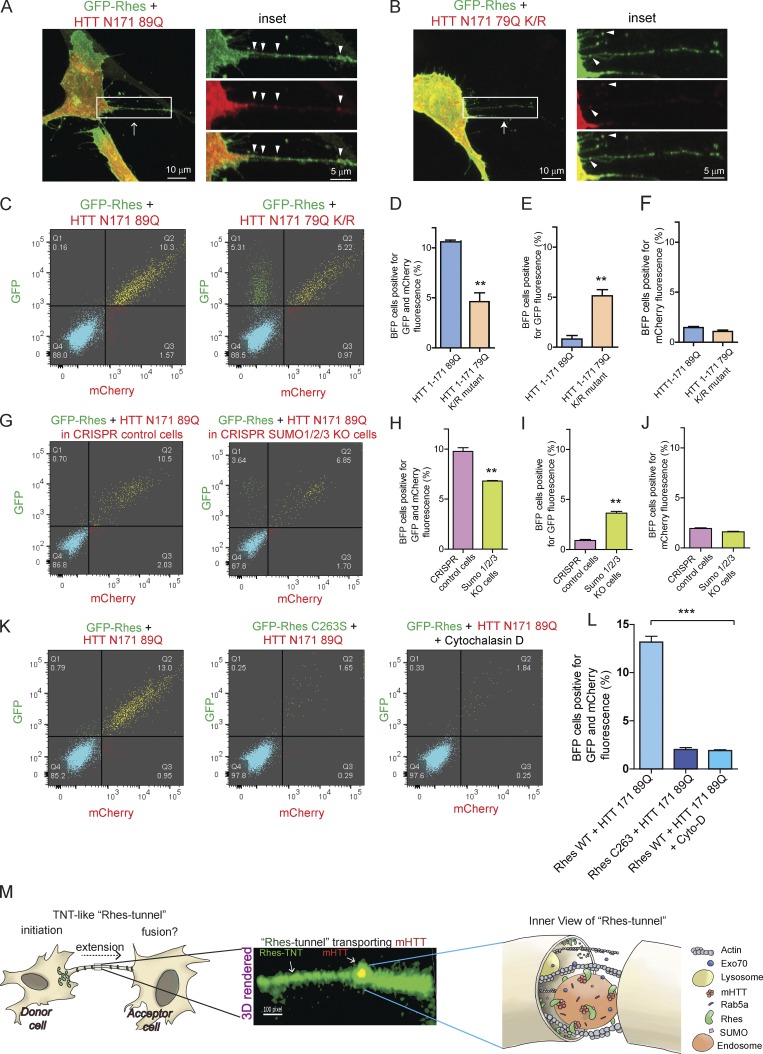
SUMO participates in Rhes-mediated cell–cell transportation of mHTT. (A) Representative confocal images of striatal neuronal cells coexpressing GFP-Rhes and mCherry-HTT N171 89Q, or (B) GFP-Rhes and mCherry-HTT N171 79Q K/R mutant (K 6, 9, 15, and 91 R). Arrow indicates TNT-like Rhes tunnel, and arrowheads indicate mHTT in Rhes tunnel. (C) Representative FACS plot of double-positive striatal neuronal cells (GFP-Rhes and mCherry-HTT N171 89Q or GFP-Rhes and mCherry-HTT N171 79Q K/R mutant) co-cultured with FACS-sorted BFP-expressing cells for 24 h (see experimental design in Fig. S7 A). (D–F) Bar graphs show data mean ± SEM; Student’s t test (**, P < 0.01), n = 3. Quantification of percentage of BFP cells positive for GFP and mCherry (D), only GFP (E), or only mCherry fluorescence (F). (G) Representative FACS plot of control CRISPR- or SUMO1/2/3-depleted double-positive striatal neuronal cells (GFP-Rhes and mCherry-HTT N171 89Q) co-cultured with FACS-sorted BFP-expressing cells (see experimental design in Fig. S7 F). (H–J) Bar graphs show data mean ± SEM; Student’s t test (**, P < 0.01), n = 3. Quantification of percentage of BFP cells, positive for both GFP and mCherry (H), for GFP only (I), or for mCherry only (J). (K) Representative FACS plot for the indicated co-cultured cells. (L) Bar graphs show mean ± SEM; one-way ANOVA (***, P < 0.001), n = 3. Quantification percentage of BFP cells positive for Rhes WT + HTT N171-89Q, Rhes C263S + HTT N171-89Q, and Rhes WT + HTT N171-89Q in cytochalasin D. (M) Model depicting the Rhes-induced TNT-like protrusion, Rhes tunnel connecting two cells, shows a 3D-rendered snapshot of a Rhes-TNT–like protrusion transporting mHTT and a view inside the Rhes tunnel.

