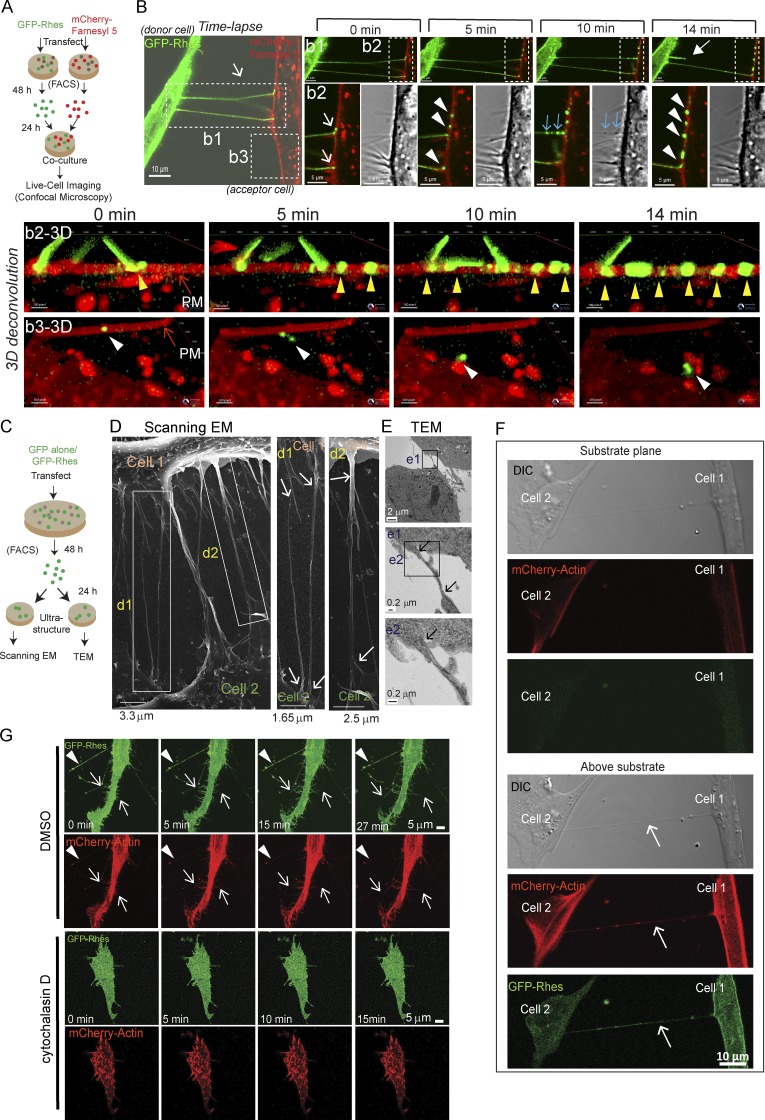
Figure 2.
Rhes-induced filopodia-like protrusions are membranous structures, show “kiss and run” properties, and are abrogated by actin polymerization inhibitor. (A) Experimental design for B. (B) Live-cell imaging of co-cultured striatal neuronal cells expressing GFP-Rhes or mCherry-Farnesyl 5 (membrane marker). Inset b1: Closed arrow shows retraction event at 14 min. Inset b2: Arrows point to TNT-like cellular protrusions interacting with membrane of mCherry-Farnesyl 5. Arrowheads (white) indicate vesicle delivery to mCherry-Farnesyl 5 cells. Blue arrows indicate newly arriving vesicles (also seen in DIC). See related Video 1. b2-3D shows 3D deconvoluted images of inset b2, and arrowheads (yellow) indicate GFP-Rhes vesicular puncta. b3-3D shows 3D convoluted images of inset b3, and arrowheads (white) indicate GFP-Rhes puncta on the membrane and its internalization. See related Video 1. (C) An experimental design for D. (D) Representative scanning EM image of FACS-sorted GFP-Rhes expressing striatal neuronal cells. d1 and d2 inset arrows point to seamless transition of TNT-like cellular protrusions between cells. (E) TEM images of FACS-sorted GFP-Rhes expressing striatal neuronal cells. Insets from e1 and e2 show arrows pointing to TNT-like cellular protrusions. (F) Representative confocal and DIC images of striatal neuronal cells coexpressing GFP-Rhes and mCherry-actin at two different planes (substrate plane or above substrate). Arrows point to TNT-like hovering structures. (G) A snapshot of different time points of confocal live-cell time-lapse images of striatal cells coexpressing GFP-Rhes and mCherry-actin in vehicle (0.1% DMSO; 0, 5, 15, or 27 min) or cytochalasin D (2 µg/ml, 8 h; 0, 5, 10, or 15 min). Arrowheads show the formation of vesicles in TNT-like protrusions; arrows indicate the formation of new protrusions positive for actin. See related Videos 2 and 3.

