Figure 3.
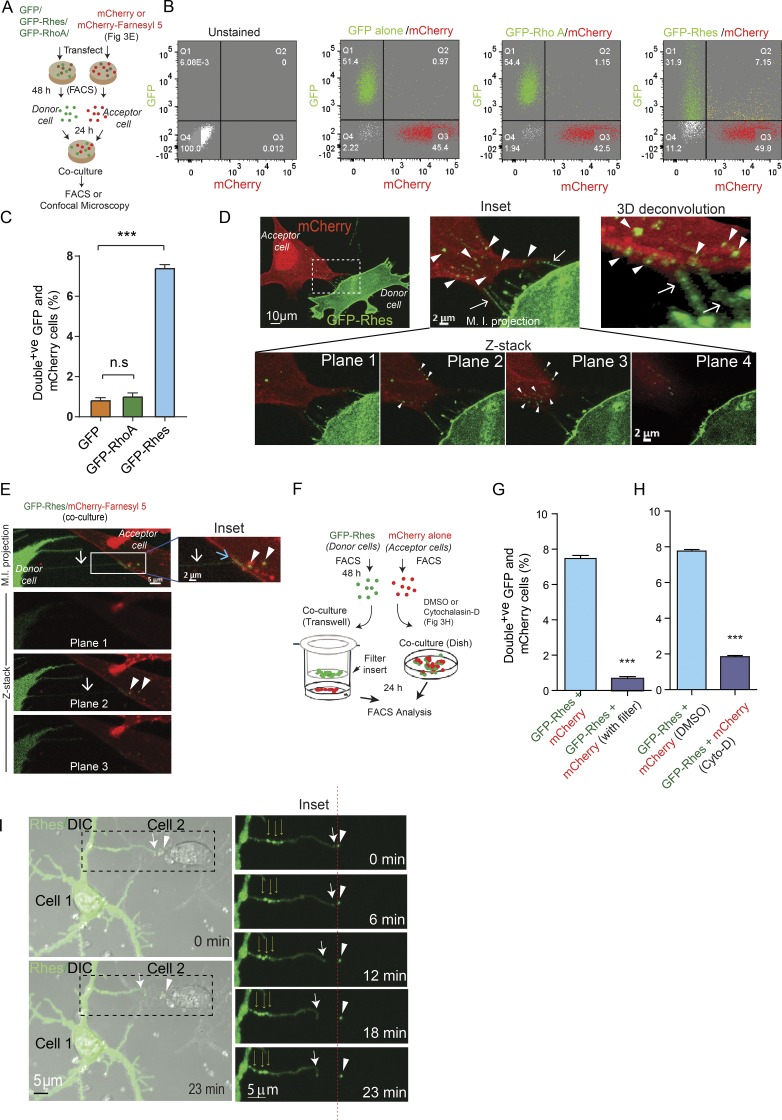
Rhes is transported to neighboring cells via TNT-like Rhes tunnels. (A) Experimental design for B and C. (B) Representative FACS analysis of co-cultured (20,000 cells) striatal neuronal cells. (C) Bar graph shows data mean ± SEM; one-way ANOVA (***, P < 0.001), n = 3. Quantification of GFP/mCherry double-positive cells (%) for GFP alone, GFP-RhoA, and GFP-Rhes. (D) Representative confocal image of co-cultured GFP-Rhes (green) and mCherry (red)–expressing cells. Arrows indicate TNT-like protrusions, and arrowheads point to vesicular structures in inset and 3D deconvoluted image (see Video 4). (E) Confocal image of FACS-sorted and co-cultured GFP-Rhes or mCherry-Farnesyl 5 (membrane marker)–expressing striatal cells. Images shown at different Z-planes (see Results). M.I. projection, maximum intensity projection. (F) Experimental design for G. (G and H) Bar graph shows data mean ± SEM; one-way ANOVA (***, P < 0.001), n = 3. Quantification of GFP/mCherry double-positive cells (%) in GFP-Rhes control (no Transwell), GFP-Rhes with Transwell, GFP-Rhes vehicle-treated (0.1% DMSO), or GFP-Rhes with cytochalasin D (Cyto-D; 2 µg/ml). (I) Time-lapse images of primary striatal neurons expressing GFP-Rhes. Thick arrows indicate TNT-like process from cell 1, thin arrows show multiple puncta in TNT, and arrowheads indicate GFP-Rhes vesicle in cell 2. Insets show the magnified images. Red dashed line indicates the movement of vesicle comparing its original position at 0 min to 13 min. See related Video 5 and its inset Video 6.

