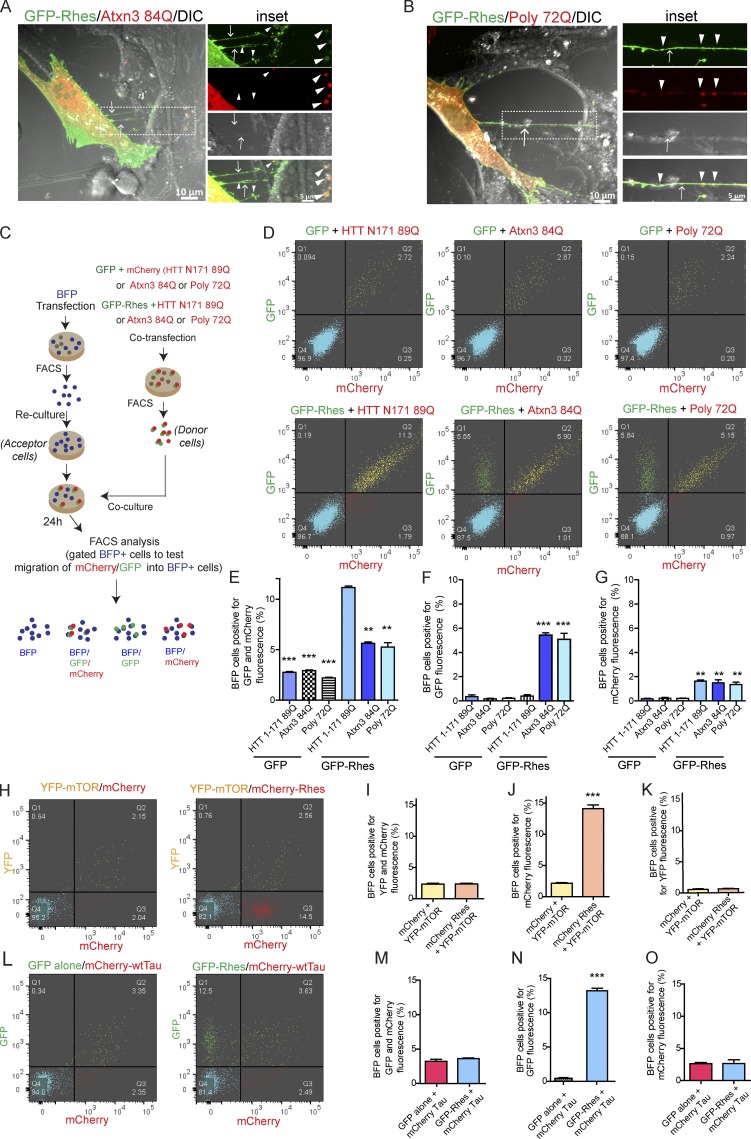
Figure 9.
Rhes transports Ataxin3 and poly 72Q protein but not mTOR or wtTau. (A and B) Representative confocal and DIC images of striatal neuronal cells expressing GFP-Rhes and mCherry-Ataxin 3 (Atxn3 84Q; A) or GFP-Rhes and mCherry-Poly 72Q (B). Arrows point to a TNT-like process. Arrowheads indicate GFP-Rhes colocalization with Atxn 84Q or Poly-72Q. (C) An experimental design for D and E. (D) Representative FACS plot for the indicated co-cultured cells. A total of 20,000 cells was recorded. (E–G) Bar graphs show data mean ± SEM; one-way ANOVA test (***, P < 0.001; **, P < 0.01), n = 3. Quantification of BFP cells (%) positive for both GFP and mCherry fluorescence (E), only GFP (F), and only mCherry (G). (H) FACS-sorted double-positive YFP-mTOR/mCherry alone or YFP-mTOR/mCherry-Rhes striatal neuronal cells (donor cells) were co-cultured with FACS-sorted BFP-expressing cells (acceptor cells). (I–K) Bar graphs show data mean ± SEM; Student’s t test (***, P < 0.001), n = 3. Quantification of BFP cells (%) positive for both YFP and mCherry fluorescence (I), mCherry only (J), or YFP only (K). (L) FACS-sorted double-positive (GFP alone/mCherry-Tau or GFP-Rhes/mCherry-Tau striatal neuronal cells [donor cells]) were co-cultured with FACS-sorted BFP-expressing cells (acceptor cells). (M–O) Bar graphs shows data mean ± SEM; Student’s t test (***, P < 0.001), n = 3. Quantification of BFP cells (%) positive for both GFP and mCherry fluorescence (M), GFP only (N), and mCherry only (O).

