Figure 7.
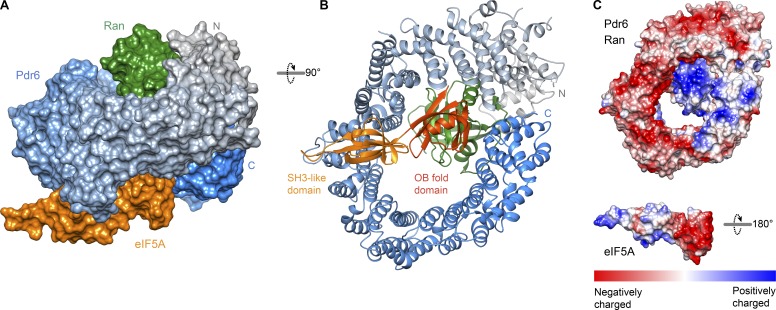
Structure of the yeast eIF5A export complex. (A and B) View of the trimeric export complex in two different orientations. (A) The complex is shown as a surface representation. Pdr6 is depicted with a color gradient from gray (N-terminus) to blue (C-terminus) while Ran is shown in green, and eIF5A is in orange. (B) The complex is rendered as a ribbon representation. Domains of eIF5A are labeled and shaded accordingly. (C) Pdr6•RanGTP and eIF5A are shaded according to electrostatic potential with a color gradient from red (negatively charged, −10 kcal/mol) to blue (positively charged, +10 kcal/mol). Pdr6•RanGTP is shown in the same orientation as in B while eIF5A is rotated 180°.

