Figure 7.
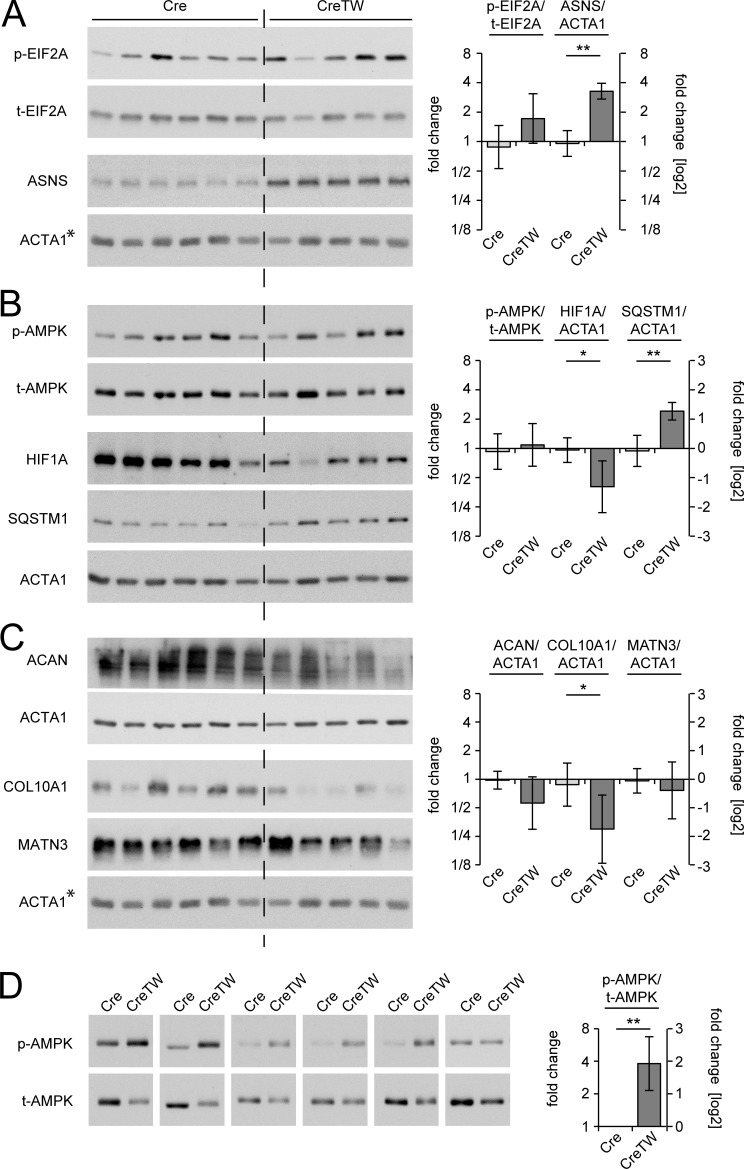
Regulation of metabolic sensitive pathways and ECM proteins. (A–C) Extracts of Cre (n = 6) and CreTW (n = 5) growth plates were analyzed for the activation of the integrated stress response (A; p-EIF2A, t-EIF2A, ASNS), the metabolic response (B; p-AMPK, t-AMPK, HIF1A, p62/SQSTM1), and for ECM proteins (C; ACAN, COL10A1, MATN3) by immunoblotting. Actin was used as loading control. *As all proteins shown in A and C were tested on a single blot, the same actin control is included in both panels. (D) The activation of AMPK was determined in extracts of cultured chondrocytes from individual isolations of 1-mo-old growth plate cartilage of Cre and CreTW mice (n = 6). ImageJ analysis was used for quantification, and fold changes in protein activation or expression between Cre and CreTW are shown (graphs). Quantitative data are mean ± SD. *P < 0.05, **P < 0.01. p-, phosphorylated protein; t-, total protein.

