Figure 5.
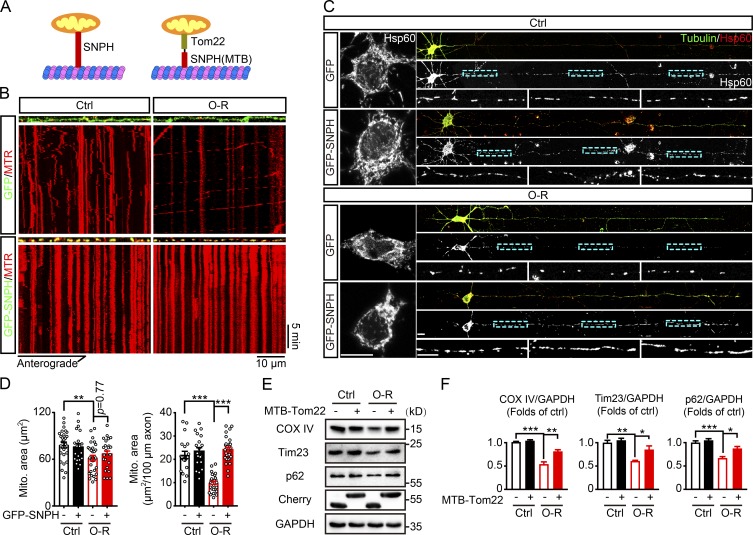
Inhibition of mitochondrial mobility by overexpression of SNPH reverses OGD-Rep–induced mitophagy. (A) Schematic diagrams of GFP-SNPH and mCherry-MTB-Tom22. (B) Primary cultured cortical neurons were previously transfected with GFP or GFP-SNPH by electroporation. After staining with 10 nM MitoTracker Red, the cultured neurons were subjected to 20 min of OGD in DIV14. At reperfusion (O-R), live cell fluorescent images of axonal mitochondria were captured by confocal microscopy for 30 min. Images show representative kymographs from three independent experiments. (C and D) Primary cultured cortical neurons were previously transfected with GFP or GFP-SNPH by electroporation and subjected to 20 min of OGD in DIV14. The mitochondrial marker Hsp60 was stained by immunocytochemistry at 40 min of reperfusion. (C) Images show representative straightened cultured neurons. (D) Columns represent the somatic mitochondrial area (left panel) and axonal mitochondrial area per 100-µm axon (right panel). n = 20–28 cells from three independent experiments for each group. (E) Primary cultured cortical neurons were previously transfected with mCherry-Tom22 or mCherry-MTB-Tom22 by electroporation and subjected to 20 min of OGD followed by 40 min of reperfusion DIV14. The COX IV, Tim23, p62, and GAPDH levels in cultured neurons were determined by Western blot. (F) Semiquantitative analysis of COX IV, Tim23, and p62 bands are shown. The data are expressed as means ± SEM. Statistical comparisons were performed with one-way ANOVA with Sidak’s multiple-comparisons test. *P < 0.05, **P < 0.01, ***P < 0.001 versus the indicated group. Scale bar, 10 µm. Ctrl, control; Mito, mitochondrial.

