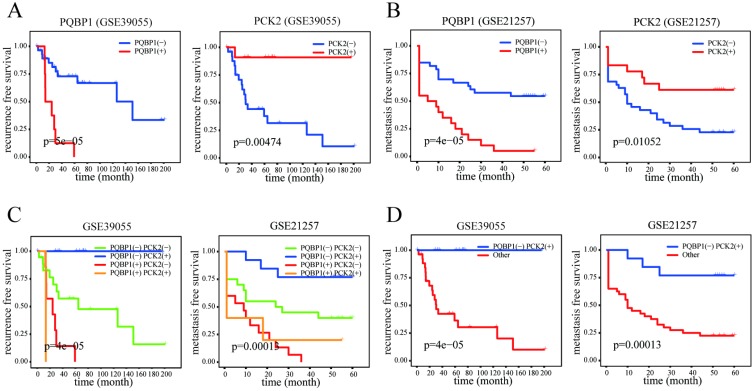
Figure 2.
Prognostic significance of PQBP1 and PCK2 expression status in OS. (A) Kaplan-Meier plots of RFS with different PQBP1 or PCK2 expression statuses in GSE39055. (B) Kaplan-Meier plots of MFS with different PQBP1 or PCK2 expression statuses in GSE21257. (C) Kaplan-Meier plots of RFS and MFS with four different combined expression profiles in GSE39055 and GSE21257, respectively. (D) Kaplan-Meier plots of RFS and MFS in binary comparison of combined expression profiles in GSE39055 and GSE21257, respectively. For both PQBP1 and PCK2, (-) represents low expression status and (+) represents high expression status.

