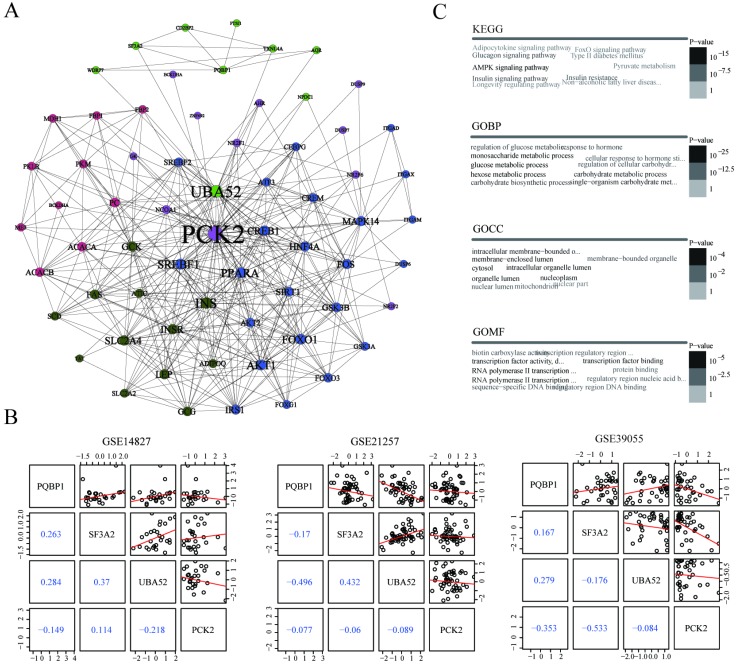
Figure 4.
Potential regulatory pattern between PQBP1 and PCK2. (A) The minimal PQBP1 and PCK2-centered undirected protein interaction network from the STRING database. Nodes represent proteins, and node size is proportional to the degree of connectivity with other proteins. Edges represent interactions between proteins. Five communities were detected and are colored-coded. (B) Pairwise correlations between expression profiles of the four axis genes in GSE14827, GSE21257, and GSE39055. In the upper triangle, black dots represent pairwise expression values in all samples in each dataset, and red lines represent linear regression values. In the lower triangle, blue numbers show Pearson's correlation coefficients between two genes. (C) Word cloud plots of top ten most significantly enriched terms among genes in the network from KEGG, GOBP, GOCC and GOMF on genes in the network. The font size and gray scale of each term were proportional to the adjusted p value.

