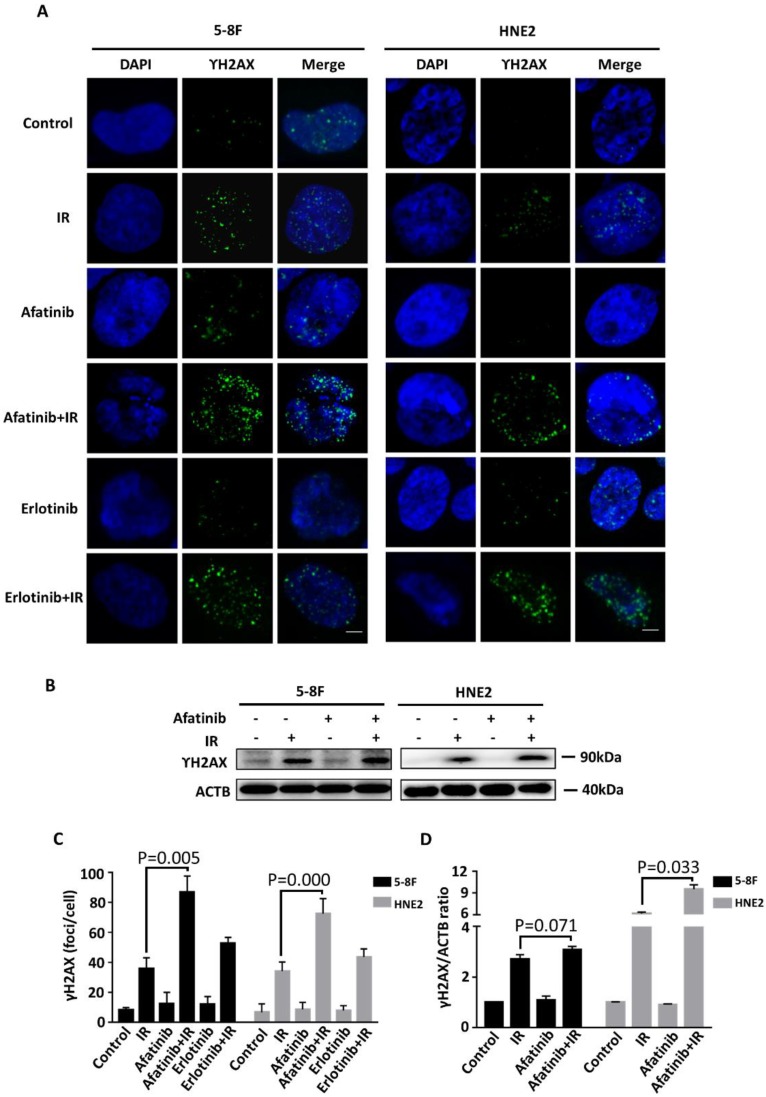
Figure 4.
Afatinib enhances radiation-induced DNA damage. (A) Confocal microscopy was used to obtain images of 5-8F cells and HNE2 cells that were treated with IR at 4 Gy and /or 2 μM afatinib as indicated. Cells were fixed 30 minutes following the treatments, and the cell nuclei were stained with γ-H2AX (green) and DAPI (blue). The scale bar represents 5μm. (B) Lysates of 5-8F and HNE2 cells that were treated as described in Figure 4A were analysed via immunoblotting to detect γ-H2AX and ACTB. (C) γ-H2AX foci in the nuclei of 5-8F cells and HNE2 cells that were treated as described in Figure 4A were quantified. For each group, at least 50 cells were counted, and the data are expressed as the means ± standard deviation. (D) Expression levels of γ-H2AX were quantified by densitometry and normalized by ACTB levels.

