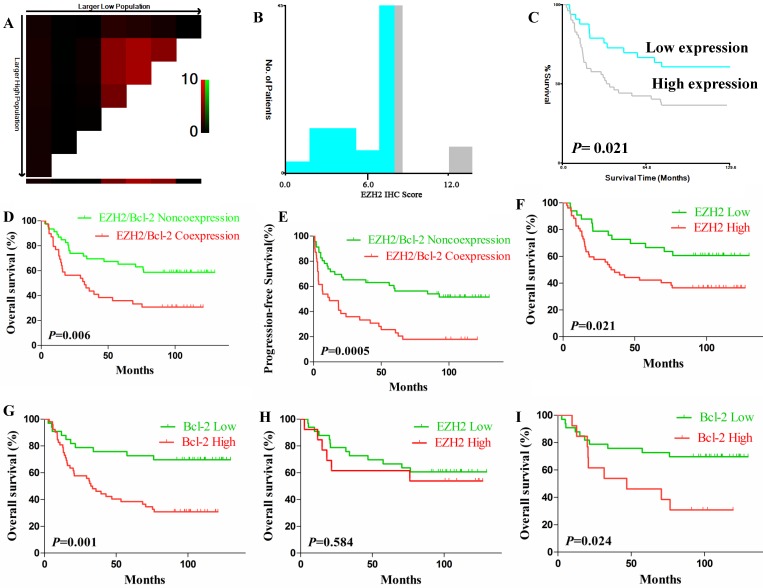
Figure 2.
X-tile plots of EZH2 expression for optimal cut-off determination and prognostic impact of EZH2 and Bcl-2 expression in test cohort. (A-B) The cut-off (IRS=6, P=0.021) was used to separate low EZH2 expression (blue) from high (gray) in the frequency histogram of whole samples. (C) Kaplan-Meier curve for testing the survival of sample subsets defined by EZH2 expression under (blue line) and above 6 (gray line). (D-E). OS (D) and PFS (E) of DLBCL patients with EZH2/Bcl-2 coexpression. (F-G). OS of patients with high expression of EZH2 (F) or Bcl-2 (G). (H-I). OS of patients with high expression of EZH2 (H) or Bcl-2 (I) when the cases with EZH2/Bcl-2 coexpression were excluded.

