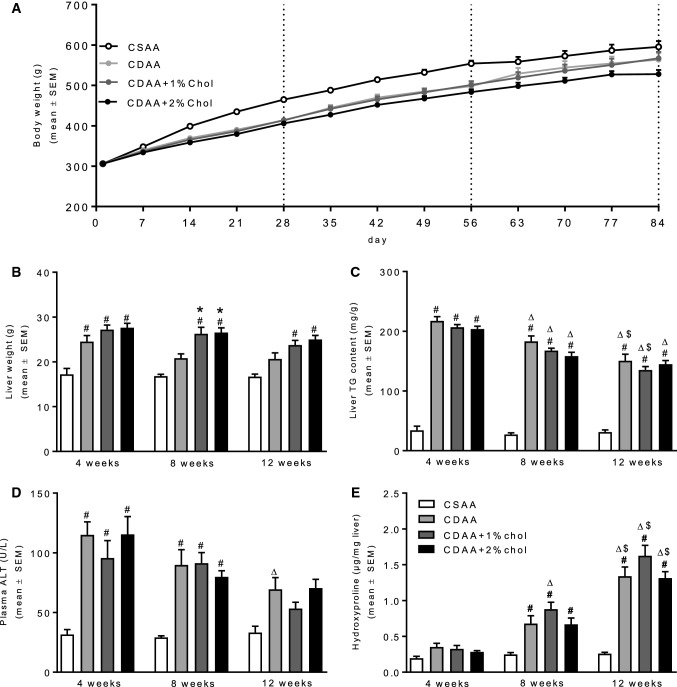
Fig. 1.
Metabolic parameters during NASH progression. a Weekly body weight throughout the diet induction. b Liver weight at termination. c Liver TG content at termination. d Plasma alanine aminotransferase (ALT) at termination. e Liver HP content at termination. #P < 0.05 versus CSAA, *P < 0.05 versus CDAA, ∆P < 0.05 versus same diet at 4 weeks, $P < 0.05 versus same diet at 8 weeks

