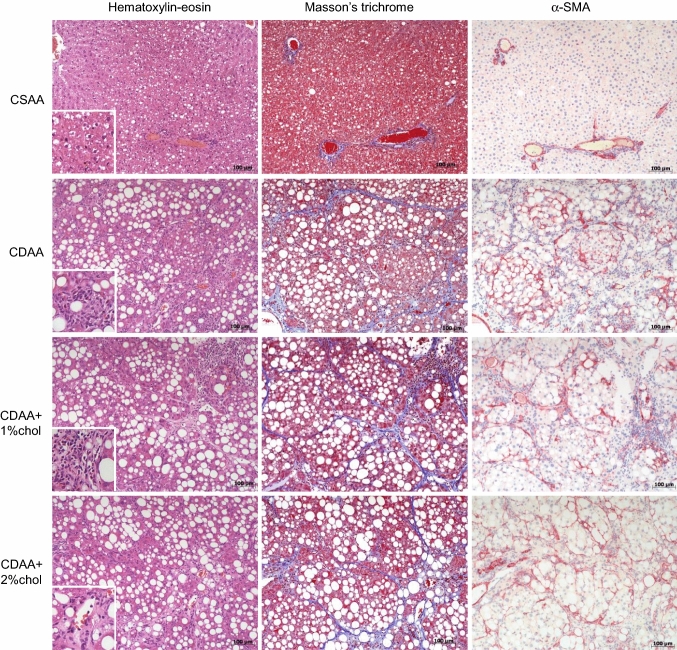
Fig. 2.
Liver histopathology during NASH progression. Representative images of hematoxylin–eosin, Masson’s trichrome and α-SMA staining after 12 weeks on the respective diets. Figure inserts in hematoxylin–eosin photomicrographs for visualizing inflammatory cell infiltrates upon CDAA dieting. Scale bar, 100 µm

