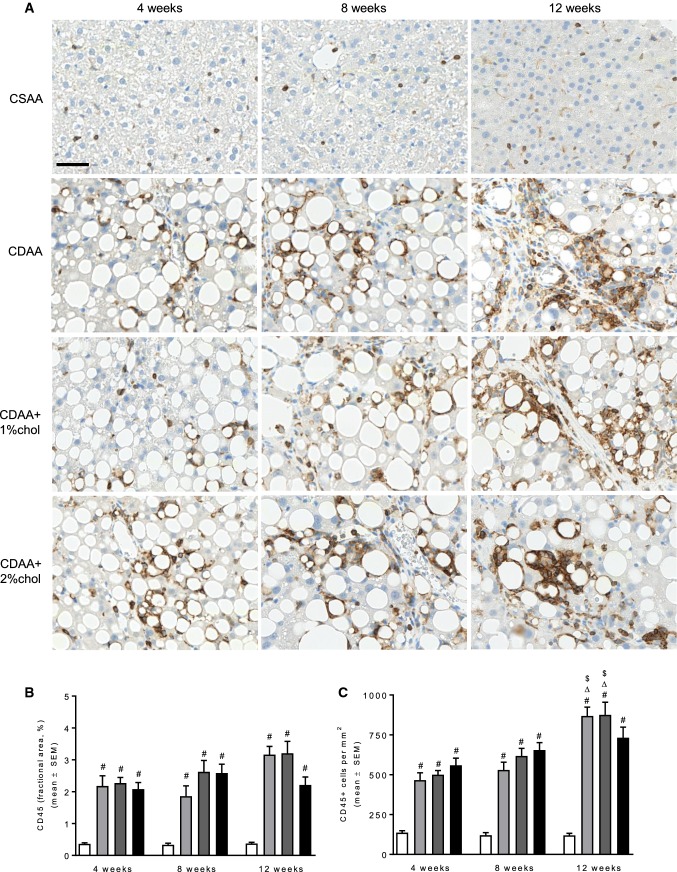
Fig. 5.
Leukocyte infiltration during NASH progression. a Representative images of CD45-positive leukocyte staining after 4–12 weeks on the respective diets. b Quantitative analysis of CD45-positive fractional area. c Quantitative analysis of the number of CD45-positive cells. Scale bar, 50 µm. #P < 0.05 versus CSAA, ∆P < 0.05 versus same diet at 4 weeks, $P < 0.05 versus same diet at 8 weeks

