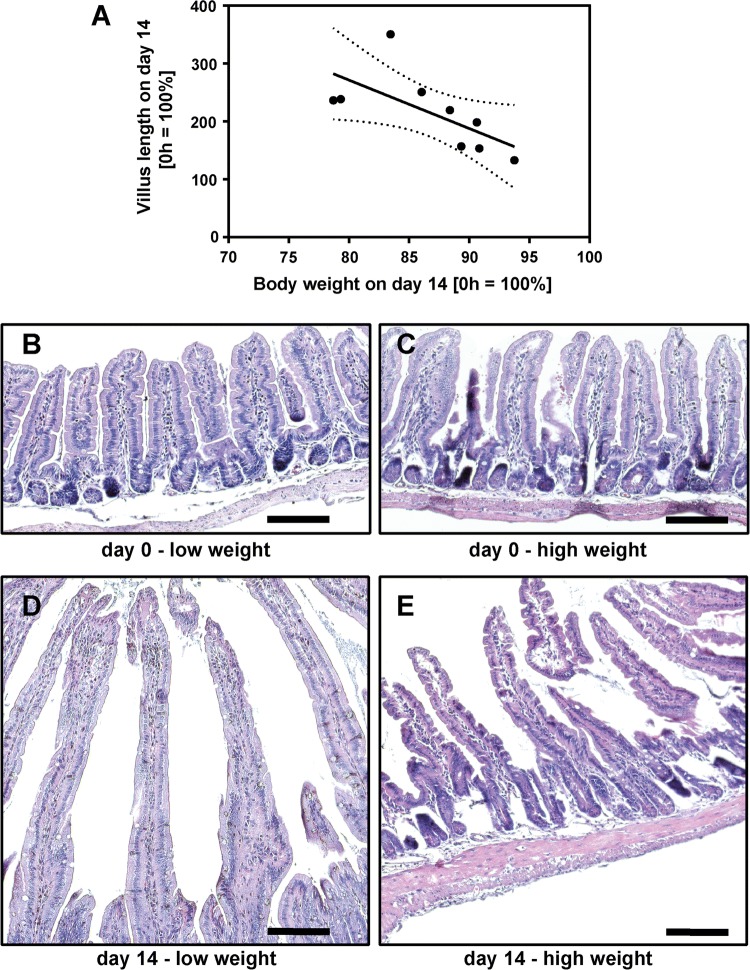
Fig. 10.
Correlation between body weight and villus length. In a random group (n = 9) of ICR mice, relative villus length (compared to d0) was correlated with relative body weight on d14 (compared to d0). Relative villus length was inversely correlated with body weight on d14. Pearson r = − 0.67, p = 0.05 (a). Representative H and E images of resected segments at day 0 (b, c) and of the corresponding adapted intestines from mice with low (d) or high (e) body weight at day 14. Note that not only villi become longer but also that the subepithelial and intravillous tissue enlarges. Scale bar represents 100 µm

