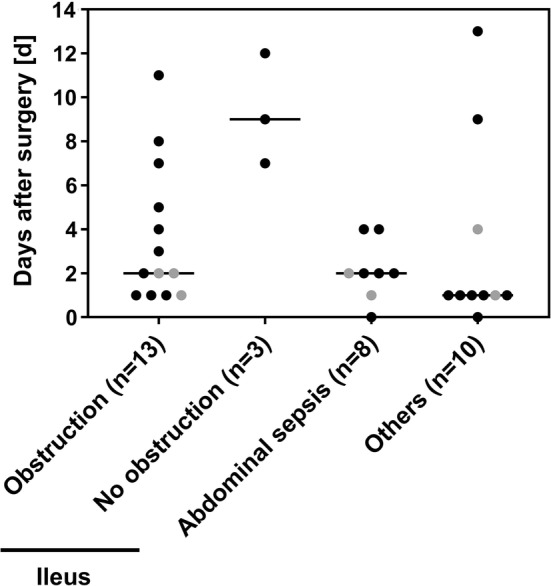
Fig. 2.

Absolute frequency of complications in ICR and sham mice related to the days of occurrence. Each symbol represents one mouse that died spontaneously or was killed because of reaching a humane endpoint: black, resected mice (n = 28); gray symbols indicate sham-operated animals (n = 6). Median is shown as a horizontal line
