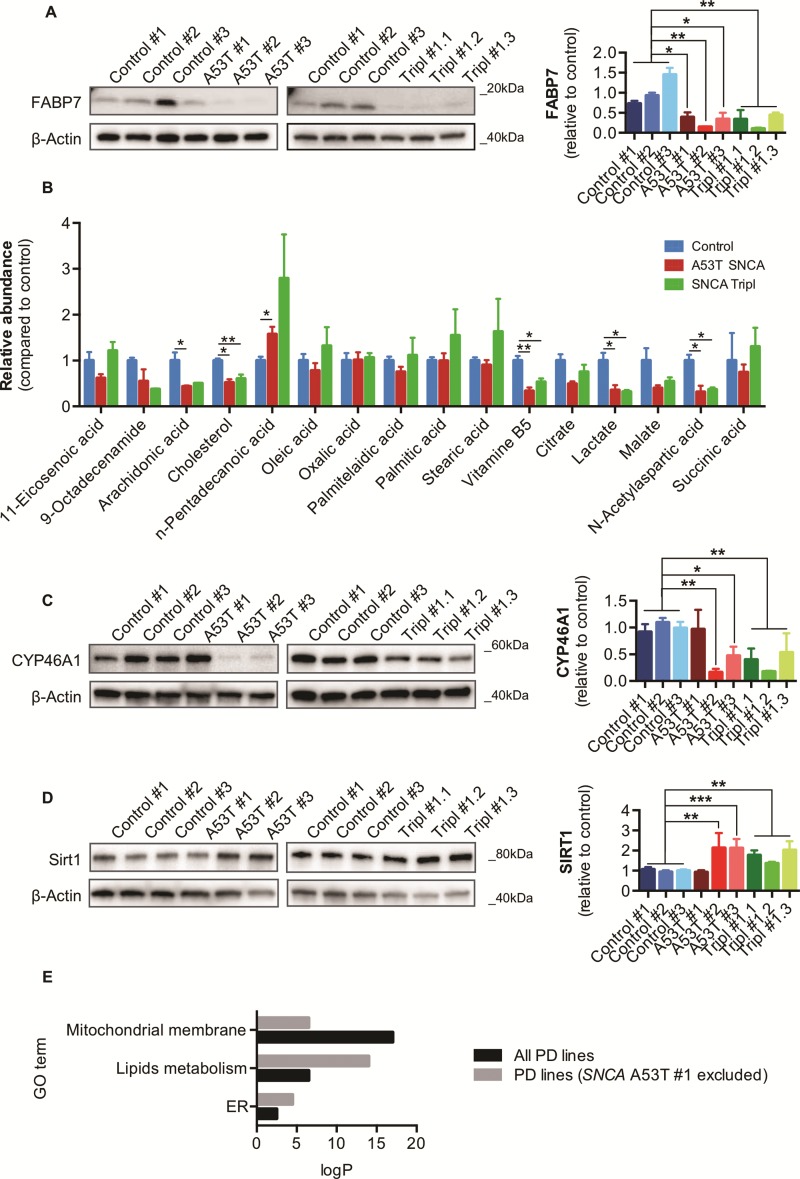
Figure 7.
Dysregulation of lipid homeostasis and metabolism in iPSC-derived A53T SNCA and SNCA Tripl DAns. (A) FABP7 protein levels in DAns (N = 3, mean ± SEM, one-way ANOVA, *P < 0.05, **P < 0.01). (B) Metabolomics analysis of DAns (N = 1, three independent lines or clones per genotype, mean ± SEM, one-way ANOVA, *P < 0.05, **P < 0.01). (C) CYP46A1 protein levels in DAns (N = 3, mean ± SEM, one-way ANOVA, *P < 0.05, **P < 0.01). (D) SIRT1 protein levels in DAns (N = 3, mean ± SEM, one-way ANOVA, **P < 0.01, ***P < 0.001). (E) Pathway analysis for the two sets of DE genes between control and PD lines (with or without A53T SNCA #1) focused on phenotypes characterized in the previous sections (ER-, lipids metabolism- and mitochondria-related terms). The significance of enrichment is reported on y axis (absolute log10 P-value) and colours represent different sets of DE genes.

