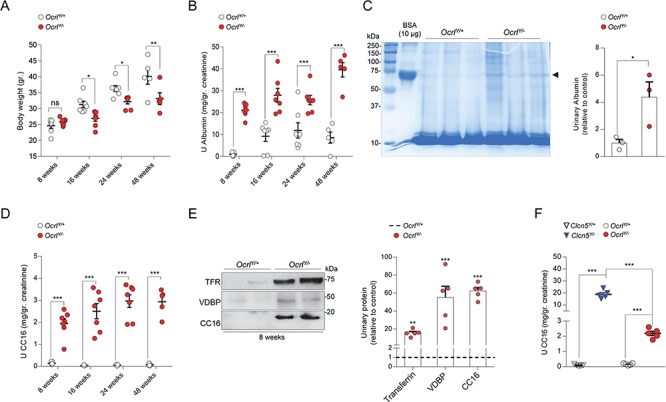
Figure 1.

Growth retardation and renal phenotype in a whole body OcrlY/− mouse model. (A) Dot plot representing the measurement of body weight, (B) albumin and (D) CC16 urinary excretion in Ocrl male mice at 8, 16, 24 and 48 weeks after birth (8 weeks, n = 7 mice per group; 16 weeks, n = 7 mice per group; 24 weeks, n = 7 mice per group; 48 weeks, n = 5 mice per group). (C) Coomassie blue-stained SDS-PAGE analysis of urine derived from 8-week-old Ocrl mice and densitometry quantification of albumin (n = 3 mice per group). A total of 10 μg of BSA were loaded as positive control [first lane; molecular weight, ~66.5 kDa; arrowhead]. (E) Representative western blotting and densitometry quantification of TFR, VDBP and CC16 in urine derived from 8-week-old Ocrl mice (TFR, VDBP and CC16, n = 5 mice per group). (F) Quantification of CC16 urinary excretion in 8-weeks-old Clcn5 and Ocrl mice (n = 5 mice per group). All the urine parameters were normalized to urinary creatinine concentration. Plotted data represent mean ± SEM. Each dot of the graphs represents one mouse. Two-tailed unpaired Student’s t-test, *P < 0.05, **P < 0.01 and ***P < 0.001 relative to OcrlY/+ or Clcn5Y/+ mice. ns: not significant.
