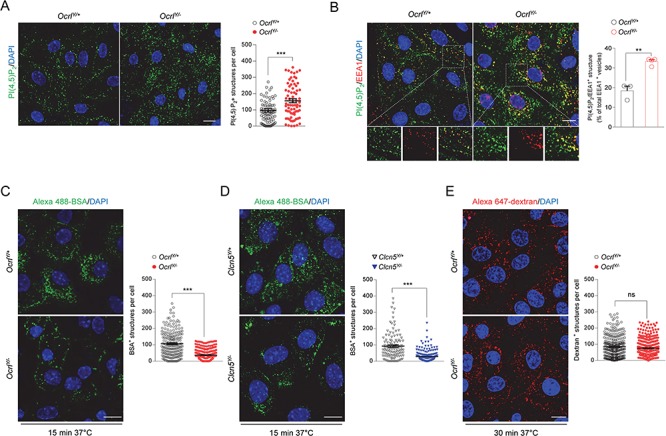
Figure 3.

Altered PI(4,5)P2 subcellular distribution and receptor-mediated endocytosis in mPTCs derived from Dent disease mouse models. (A) Representative confocal micrographs and quantification of PI(4,5)P2+ structures (green) in Ocrl mPTCs (n ≈ 80 cells pooled from 3 mouse kidneys per condition; each dot representing the number of PI (4,5)P2+ structures in a cell). (B) Representative confocal micrographs of Ocrl mPTCs immunostained with anti-PI(4,5)P2 (green) and anti-EEA1 (red, early endosomes) and quantification (adjacent panel) of the number of PI(4,5)P2/EEA1+ structures by confocal microscopy (percentage of total EEA1+ vesicles: n = 3 OcrlY/+ and n = 4 OcrlY/− randomly selected fields per condition, each containing approximately 15–20 cells). Insets: high magnification of PI(4,5)P2/EEA1+ structures. (C,D) Ocrl and Clcn5 mPTCs were loaded with Alexa 488-BSA (green, 100 μg ml−1 for 15 min at 37°C), fixed and analyzed by confocal microscopy. Quantification of the number of Alexa 488-BSA+ structures (n ≈ 150–250 cells pooled from 3 mouse kidneys per condition; each dot representing the number of BSA+ structures in a cell). (E) Ocrl mPTCs were loaded with Alexa 647-dextran 10 kDa (red, 250 μg ml−1 for 30 min at 37°C), fixed and analyzed by confocal microscopy. Quantification of the number of Alexa 647-dextran+ structures (n ≈ 200–250 cells pooled from 3 mouse kidneys per condition; each dot representing the number of dextran+ structures in a cell). Nuclei counterstained with DAPI (blue). Scale bars: 15 μm in (A) and (B) and 10 μm in (C–E). Plotted data represent mean ± SEM. Two-tailed unpaired Student’s t-test, **P < 0.01, ***P < 0.001 relative to OcrlY/+or Clcn5Y/+ mPTCs. ns: not significant.
