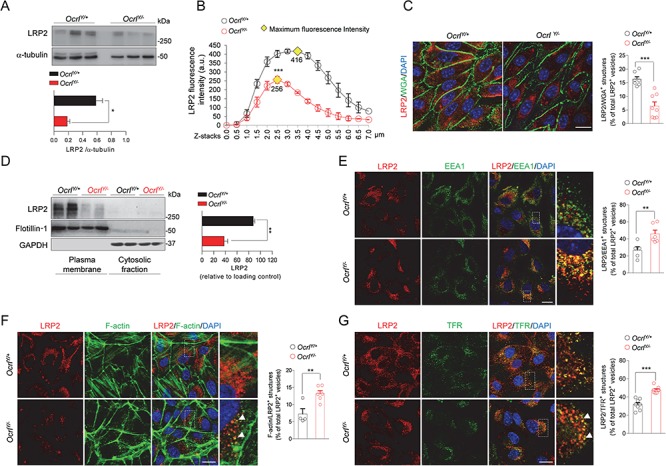
Figure 4.

OcrlY/− mPTCs exhibit decreased expression of LRP2 and defective endocytic recycling. (A) Representative western blotting and quantification of LRP2 in whole Ocrl mPTCs lysates. α-tubulin was used as loading control (n = 4 mice per group). (B) Dot plot representing distribution and average fluorescence intensity of LRP2 along Z-stacks projections in Ocrl mPTCs. Yellow rhombus represents the maximum peak of fluorescence intensity. Quantifications of Z-stacks were obtained from 3 randomly selected fields per condition, with each containing approximately 15–20 cells. (C) Representative confocal micrographs and quantification of LRP2/WGA+ structures by confocal microscopy (percentage of total LRP2+ vesicles: n = 7 OcrlY/+ and n = 8 OcrlY/− randomly selected fields per condition, each containing approximately 10–15 cells). (D) Representative western blotting and quantification of LRP2 protein levels in plasma membrane fractions derived from Ocrl mPTCs. Flotillin-1 and GAPDH were used as purity marker and loading control of the plasma membrane and cytosolic fractions respectively (n = 3 independent experiment). (E) Representative confocal micrographs of Ocrl mPTCs immunostained with anti-LRP2 (red) and anti-EEA1 (green, early endosomes) and quantification (adjacent panel) of the number of LRP2/EEA1+ structures by confocal microscopy (percentage of total LRP2+ vesicles: n = 5 OcrlY/+ and n = 6 OcrlY/− randomly selected fields per condition, each containing approximately 15–20 cells). Insets: high magnification of LRP2/EEA1+ structures. (F) Representative confocal micrographs of Ocrl mPTCs immunostained with anti-LRP2 (red) and Alexa-Fluor-488-phalloidin (green, F-actin). Quantification (adjacent panel) of the number of F-Actin/LRP2+ structures (percentage of total LRP2+ vesicles: n = 4 OcrlY/+ and n = 6 OcrlY/− randomly selected fields per condition, each containing approximately 10–15 cells). Insets: high magnification of F-actin/LRP2+ structures. (G) Representative confocal micrographs of Ocrl mPTCs stained with anti-TFR (green) and anti-LRP2 (red) and quantification of the number of TFR/LRP2+ structures by confocal microscopy (percentage of total LRP2+ vesicles: n = 8 randomly selected fields per condition, each containing approximately 20–25 cells). Insets: high magnification of TFR/LRP2+ structures. Nuclei counterstained with DAPI (blue) in (C) and (E–G). Scale bars: 15 μm in (E–G) and 20 μm in (C). Plotted data represent mean ± SEM. Two-tailed unpaired Student’s t-test, *P < 0.05, **P < 0.01 and ***P < 0.001 relative to OcrlY/+ mPTCs.
