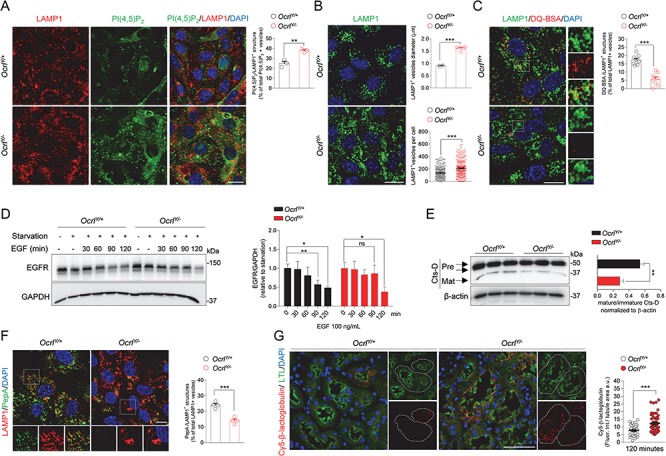
Figure 5.

Altered lysosomal dynamics and degradative capacity in OcrlY/− mPTCs. (A) Ocrl mPTCs were immunostained with anti-PI(4,5)P2 (green) and anti-LAMP1 (red, lysosomes) and the number of PI(4,5)P2/LAMP1+ structures were quantified by confocal microscopy (percentage of total PI(4,5)P2+ vesicles: n = 3 randomly selected fields per condition, each containing approximately 40–50 cells). (B) Representative confocal micrographs of Ocrl mPTCs immunostained with anti-LAMP1 (green). Quantification of the average LAMP1+ vesicles diameter (top, n = 4 OcrlY/+ and n = 6 OcrlY/− randomly selected fields per condition, each containing approximately 50–60 cells) and number of structures (bottom, n ≈ 200–220 cells pooled from 3 Ocrl kidneys per group, each point representing the number of LAMP1+ structure in a cell). (C) Ocrl mPTCs were loaded with DQ Red BSA (red, 10 μg ml−1 for 1 h at 37°C), immunostained with anti-LAMP1 (green, lysosomes) fixed and analyzed by confocal microscopy. Quantification of number of DQ Red BSA/LAMP1+ structures (percentage of total LAMP1+ structures: n = 8 randomly selected fields per condition, with each containing approximately 10–15 cells). Insets: high magnification of DQ Red BSA/LAMP1+ vesicles. (D) Ocrl mPTCs were serum starved for 24 h and then stimulated with EGF (100 ng ml-1) for the indicated times. EGFR protein levels were evaluated by western blotting and quantified relative to time 0 (starved cells; n = 3 mice per group; two-tailed unpaired Student’s t-test, *P < 0.05, **P < 0.01 relative to OcrlY/+ or OcrlY/− starved mPTCs. ns: not significant). (E) Western blotting and densitometry analyses of Cathepsin D (Cts-D) protein levels in Ocrl mPTCs (n = 4 mice per group). (F) Ocrl mPTCs were loaded with Bodipy-FL-PepA (1 μm, for 1 h at 37°C, green), immunostained with anti-LAMP1 antibody (red) and analyzed by confocal microscopy. Quantification of numbers of PepA/LAMP1+ structures (percentage of total LAMP1+ structures: n = 4 randomly selected fields per condition, with each containing approximately 20–25 cells). (G) Representative confocal micrographs showing Cy5-labeled β-lactoglobulin (red) after 120 min from tail vein injections and quantifications of the corresponding fluorescent signal in LTL+ PTs from Ocrl mouse kidneys (n = 50 Ocrl PTs; each dot representing fluorescence intensity in one PT; fluorescence intensity was normalized on tubule area). Nuclei counterstained with DAPI (blue) in (A–C), (F) and (G). Scale bars: 15 μm in (A–C), 10 μm in (F) and 50 μm in (G). Plotted data represent mean ± SEM. Two-tailed unpaired Student’s t-test. **P < 0.01, ***P < 0.001 relative to OcrlY/+ mPTCs or kidneys.
