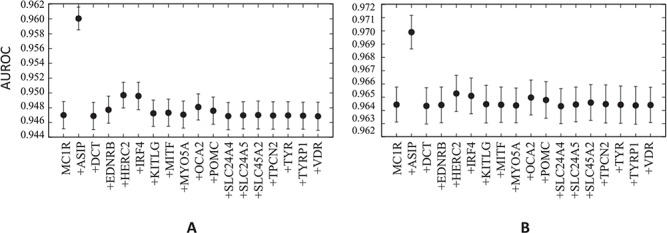
Figure 5.

AUROC curves for (A) mRMR and (B) LASSO models using 10 top MC1R genetic variants and 10 top genetic variants from each gene for mRMR and 100 top genetic variants from each gene for LASSO. Red versus other hair colour. For both mRMR and LASSO, the model performance for all genes is statistically significantly different from the model using only MC1R variants. Despite the 10 iterations of 10-fold cross-validation to obtain an estimate of mean ROC performance, error bars for the 95% confidence interval are based on a standard error of the mean assuming a sample size of 10 rather than 100 due to lack of test set independence in folds between cross-validation iterations.
