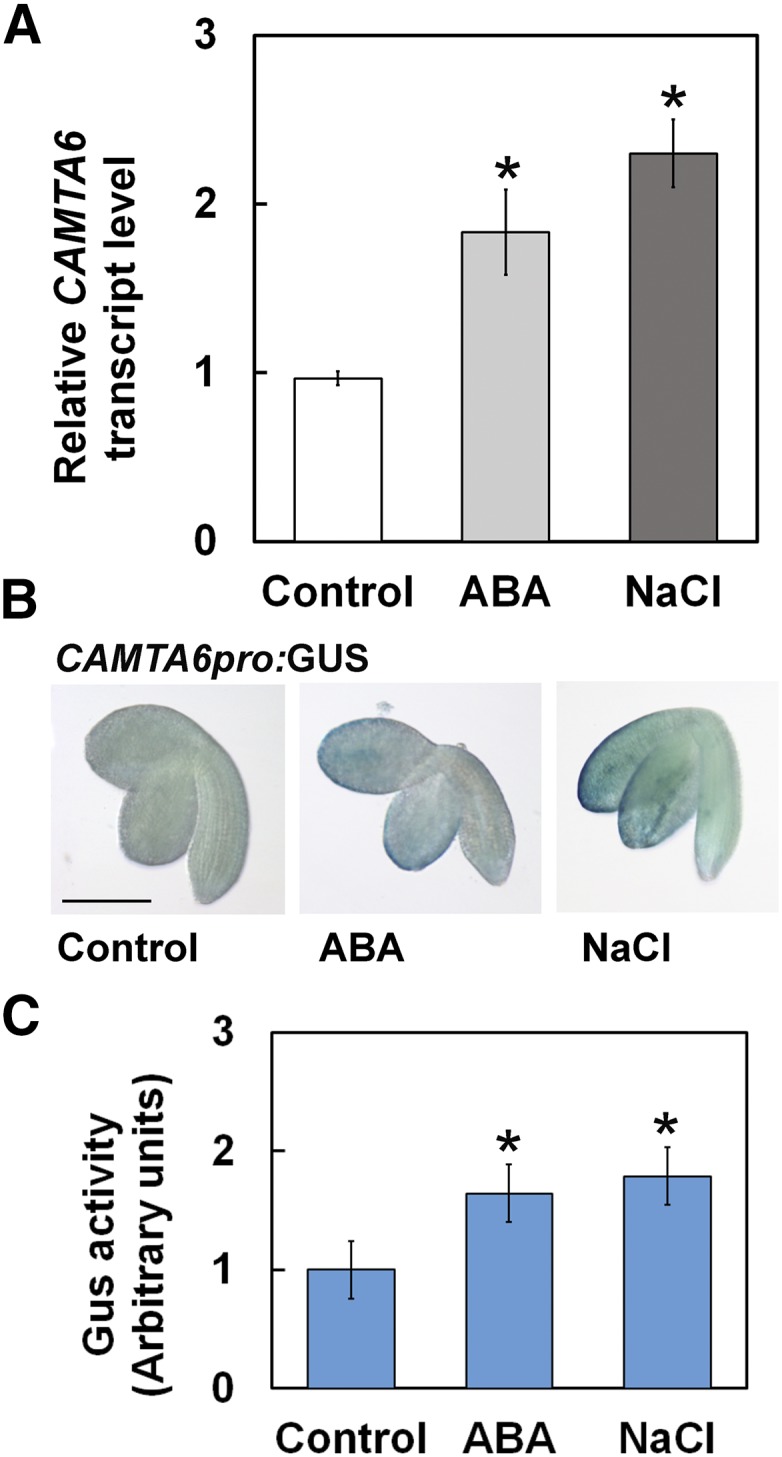
Figure 2.

CAMTA6 expression is enhanced by NaCl and ABA. A, RT-qPCR analysis for relative CAMTA6 transcript quantification in pregerminated seedlings. Data represent means ± sd (three biological experiments, ∼30 seeds each). B, GUS staining of CAMTA6pro:GUS pregerminated transgenic seedlings. Bar = 1 mm. C, Fluorometric assay of the expression levels of GUS activity in CAMTA6pro:GUS pregerminated transgenic seedlings. The values were normalized versus the GUS activity in the control (designated as 1) and are presented in arbitrary units. Data represent means ± sd (three biological experiments, ∼20 seeds each). In A, B, and C, seeds were treated with 0 (control) or 200 mm NaCl or 10 µm ABA for 16 h prior to seedling ejection. In A and C, *, P < 0.01, Student’s t test, versus control.
