Figure 2.
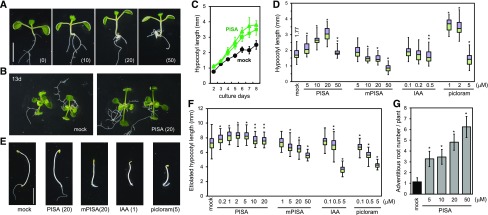
Effects of PISA on hypocotyl elongation and adventitious root formation. A, Arabidopsis seedlings cultured for 7 d with PISA. The values in parentheses represent the concentration of chemicals (micromolar). Bar = 5 mm. B, 13-d–old plants grown with PISA. C, Time course of hypocotyl length of seedlings cultured with PISA (solid square = 10 μm; solid triangle = 20 μM). Values are the means ± sd (n = 15–20). D, Hypocotyl lengths of seedlings cultured for 7 d with PISA and auxins. The hypocotyl length (millimeters) of the mock-treated seedlings is indicated. Box-and-whisker plots show a median (centerline), upper/lower quartiles (box limits), and maximum/minimum (whiskers; n = 30–38). Statistical significance assessed by Welch’s two-sample t test. Asterisks indicate significant differences (**P < 0.05, *P < 0.01). E, Etiolated seedlings cultured for 5 d in dark with PISA and auxins. F, Hypocotyl lengths of etiolated seedling cultured for 3 d in dark with PISA and auxins. Statistical significance assessed by Welch’s two-sample t test. Asterisks indicate significant differences (n = 50–72, **P < 0.05, *P < 0.01). G, Adventitious root production induced by PISA. Arabidopsis seedlings were cultured for 7 d with PISA and the adventitious root number at shoot and root junction was counted. Asterisks indicate significant differences (n = 30, **P < 0.05, *P < 0.01).

