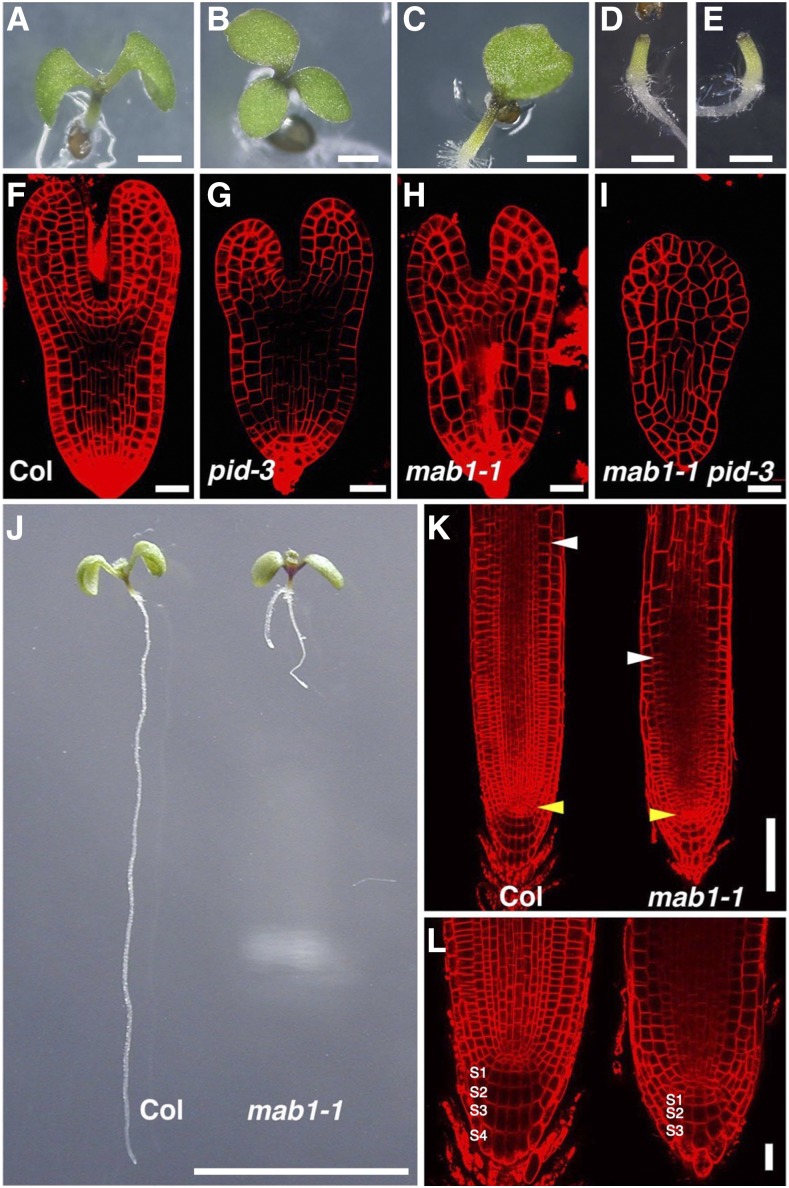
Figure 1.
Defective organ development in mab1 mutants. A to E, Five-day-old seedlings: Wild type (Col; A), pid-3 (B), mab1-1 (C), mab1-1 pid-3 (D), and mab1-2 pid-3 (E). F to I, Comparison of wild-type (Col; F), pid-3 (G), mab1-1 (H), and mab1-1 pid-3 (I) embryos at the late heart stage. J, Root development in 5-d-old wild-type (Col; left) and mab1-1 (right) seedlings. mab1-1 mutants show a short root phenotype. K and L, Comparison of wild-type (Col; left) and mab1-1 (right) root meristems. S1 to S4 indicate columella cell tiers. Yellow arrowheads indicate quiescent center cells, whereas white arrowheads represent the cortex transition zones (K). Scale bars = 1 mm (A to E), 20 µm (F to I, L), 1 cm (J), and 100 µm (K).

