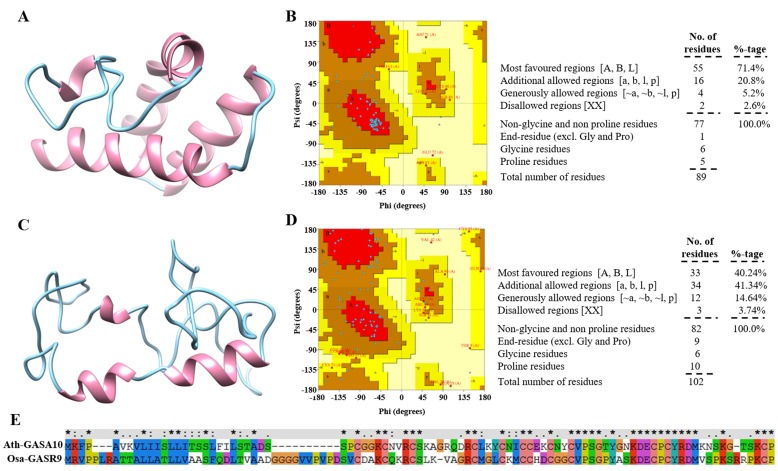
Figure 9.
Modeled 3D structure of Ath-GASA10 and Osa-GASR9 and its quality check. The protein 3D structures of Ath-GASA10 (A) and Osa-GASR9 (C) were predicted and stereochemical quality was checked using I-TASSER and PROCHECK, respectively. B and D, Ramachandran plot analysis was performed on Ath-GASA10 (B) and Osa-GASR9 (D). 3D structure was visualized through Chimera v 1.6.2. The α-helix is represented in magenta and the coiled coil in cyan. E, Multiple-sequence alignment between Ath-GASA10 and Osa-GASR9 is shown.

