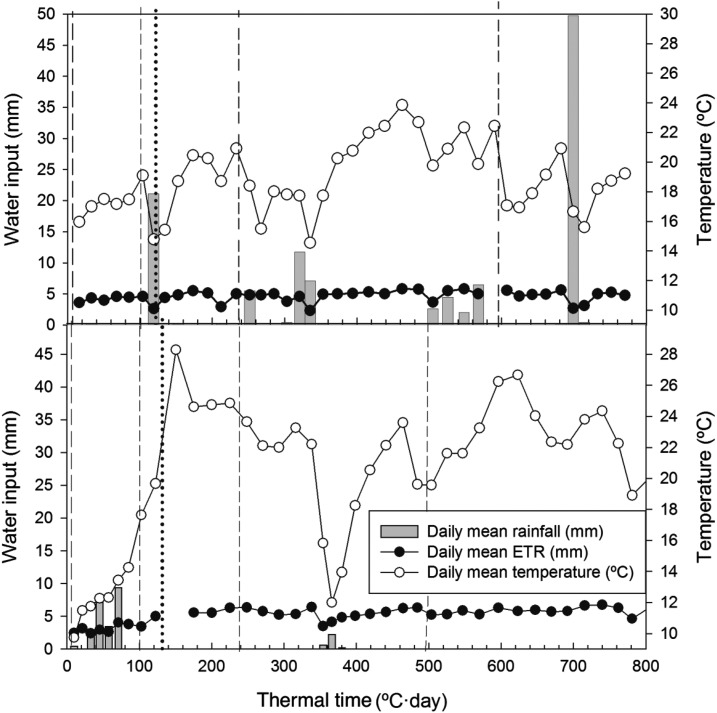
Figure 5.
Daily mean precipitation (mm), evapotranspiration (mm), and air temperature (°C) during the growing season from flowering to physiological maturity expressed as thermal time (°C·day) during the 2010 (top panel) and 2011 crop seasons (bottom panel). ETR = electron transport rate. Vertical dashed lines = dates of irrigation. Vertical dotted lines = sampling dates.

