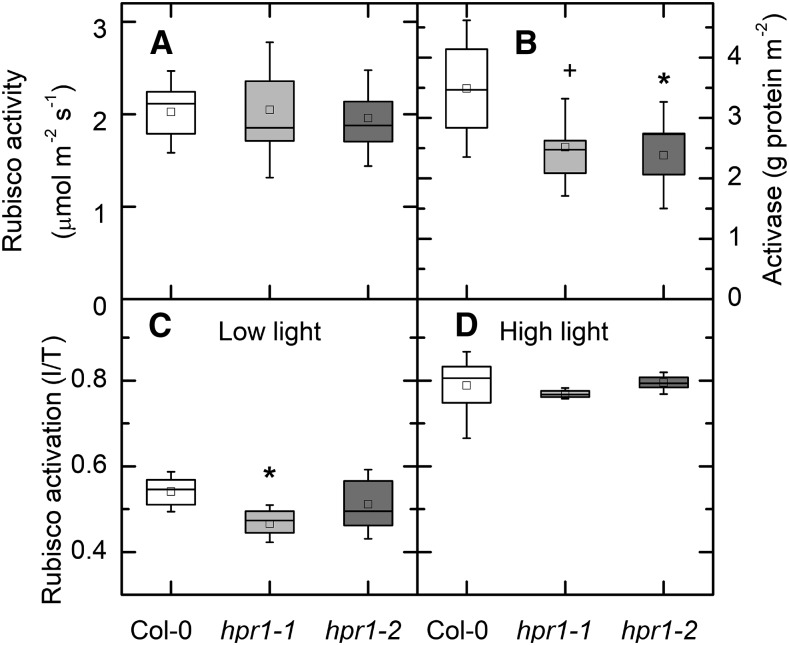
Figure 2.
Rubisco activity and activase protein. A and B, Total Rubisco activity (A) and Rubisco activase protein (B). Activase protein was measured using antibodies raised against Rubisco activase and a WES capillary electrophoresis instrument from ProteinSimple. C and D, Rubisco activation state is presented as the ratio between initial (I; measured as quickly as possible after extraction) and total (T; after incubation with HCO3 and Mg) at 125 (C) or 1,000 (D) μmol photons m−2 s−1. For A, C, and D, n = 4 to 7. For B, data were not different between the low-light and high-light treatments and so were combined (n = 7 or 8). Differences between the wild type and treatments were tested by one-way ANOVA followed by Tukey’s test. The box encompasses the middle two quartiles, the mean is shown as an open square inside the box, the median is shown as a line inside the box, and the whiskers show the sd of the data. Statistical differences are indicated as follows: +, α = 0.1 and *, α = 0.05.

