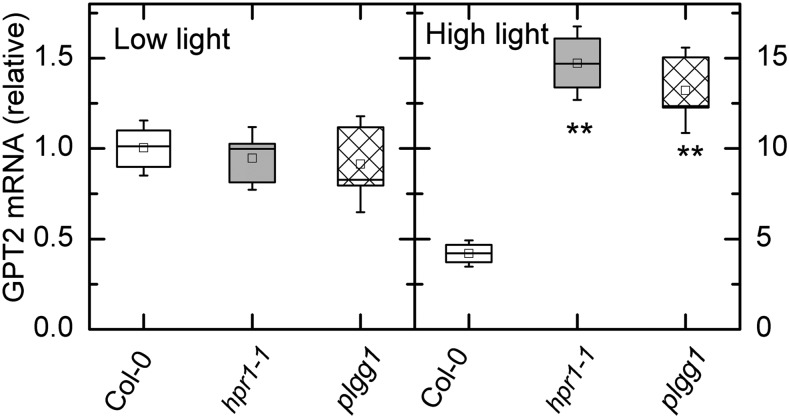
Figure 6.
Reverse transcription quantitative PCR analysis of GPT2 transcripts in low and high light. Transcripts were measured in two photorespiratory mutant lines and the wild type (Col-0) in plants taken from low light intensity (125 µmol m−2 s−1) and after 6 h (A) and high light (500 µmol m−2 s−1; B). Note that the scale is 10-fold higher for the high-light data, thus GPT2 transcript was about 4-fold higher in Col-0 after the high-light treatment and about 15-fold higher in the hpr1 mutants. Differences between the wild type and treatments were tested by one-way ANOVA followed by Tukey’s test. The box encompasses the middle two quartiles, the mean is shown as an open square inside the box, the median is shown as a line inside the box, and the whiskers show the sd of the data. Statistical differences are indicated as follows: **, α = 0.01. n = 3.

